Energy Efficiency is for Real, Energy Rebound a Distraction
Written by:
Shakeb Afsah and
Kendyl Salcito and Chris Wielga* • Jan 11, 2012
Topic: energy efficiency
Summary
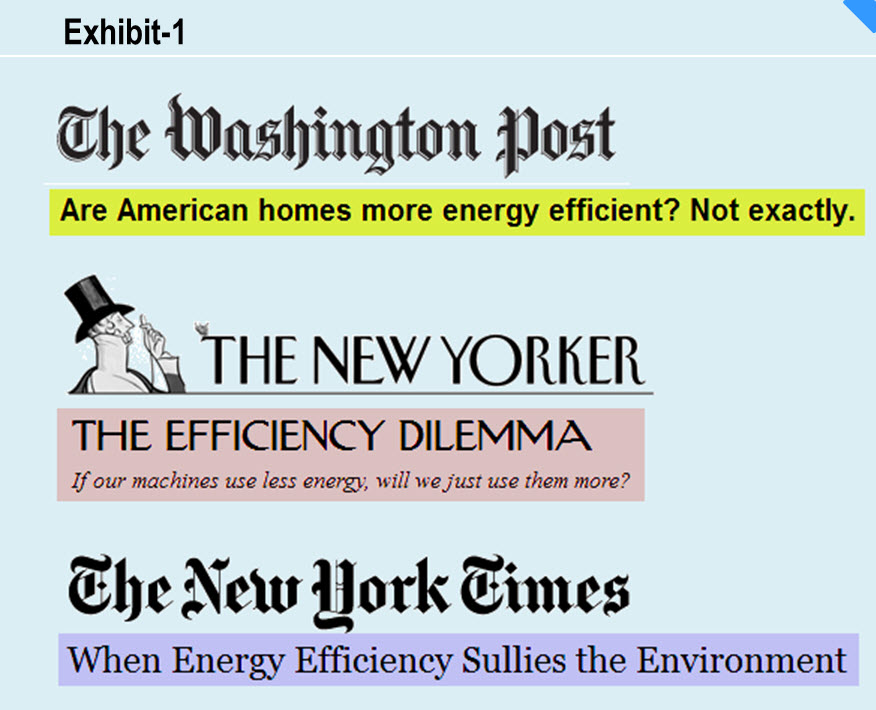
Energy efficiency is an over-rated policy tool when it comes to cutting energy use and CO2 emissions—that’s the basic message promoted by the US think tank the Breakthrough Institute (BTI), and amplified in major news outlets like the New Yorker and the New York Times. Their logic is that every action to conserve energy through efficient use leads to an opposite reaction to consume more energy—a “rebound” mechanism, which, according to the BTI, can negate as much as 60-100% of saved energy, and in some cases can backfire to increase net energy consumption.
In this research note we refute this policy message and show that the BTI, as well as its champions in the media, have overplayed their hand, supporting their case with anecdotes and analysis that don’t measure up against theory and data. Our fact-checking revealed that empirical estimates of energy rebound cited by the BTI are over-estimated or wrong, and they contradict the technological reality of energy efficiency gains observed in many industrial sectors.
We provide new statistical evidence to show that energy efficiency policies and programs can reliably cut energy use—a finding that is consistent with the policy stance of leading experts and organizations like the US Energy Information Agency (EIA) and the World Bank. Additionally, we take our policy message one step further—by using new insights from the emerging multi-disciplinary literature on “energy efficiency gap”, we recommend that the world needs more energy efficiency policies and programs to cut greenhouse gases—not less as implied by the BTI and its cohorts in the media.
Corresponding author: Kendyl.Salcito@CO2Scorecard.org
*Chris Wielga was a summer intern at the CO2 Scorecard Group in 2011.
We are thankful to several commenters who provided helpful feedback on this research note. All the views and opinions expressed in this note should be attributed only to the authors and the CO2 Scorecard Group. This research note is supported solely by the efforts and resources of The CO2Scorecard Group and the parent consulting firm Performeks LLC based in Bethesda MD, US.
Download pdf
Full Report
Is energy efficiency a curse in disguise? This policy instrument, long held in high esteem and considered to be the single most pragmatic choice currently available for cutting energy use and CO2 emissions, has recently come under question.
 The past year has been particularly hard on energy efficiency, handing it a major thrashing in the press. Much of the literature behind these news reports flow from a young US think tank called The Breakthrough Institute (BTI). The BTI has applied the concept of a “Rebound Effect” to characterize energy efficiency policies as a medicine whose side-effects outweigh the benefits. Energy efficiency, they say, is self-defeating because it creates incentives for more energy use.
Propagated last year in a number of reports, the Rebound Effect has become another policy dispute on the climate turf. It calls into question the calculations of reputable organizations like the International Energy Agency (IEA), McKinsey & Company, British Petroleum, and PricewaterhouseCoopers (PwC) who estimate that energy efficiency alone can cut greenhouse gases by 25-40%.
The Rebound Effect deserves to be taken seriously, not just because there is an undeniable trend in global energy use to show that humanity has never successfully decreased energy use, but also because the idea is extremely powerful for those seeking reasons to disregard efficiency – whether in support of an alternate climate initiatives or in opposition to climate change in general. If the Rebound Effect can take back as much as 60-100% of energy savings, as implied by the narrative sketched by the BTI, there is no way that the world can achieve the projected reductions in GHG emissions from energy efficient approaches. In essence, the Rebound Effect has the power to derail climate policy as a whole, simply by calling into question energy efficiency.
Recognizing this seriousness, we began a detailed investigation of the economics and the science behind the Rebound Effect. We examined the sources of energy Rebound resurgence, finding that the current polemic against energy efficiency is largely fuelled by a study that is neither published nor peer-reviewed. We review the literature on energy Rebound at household and production-sector levels and identify weaknesses in both the source data and the methodology employed by Rebound’s proponents. We not only disprove the claims of Reboundistas but through our original statistical analysis we reaffirm that energy efficiency policies indeed reduce per capita energy use.
Resurgence of Rebound—Nostalgia for Mr. Jevons
The Rebound Effect has few proponents among economists and energy efficiency scientists, but it resurfaces periodically. In the past year, it has gained significant ground, scoring recognition in The New Yorker, The New York Times, Conservation Magazine, Nature and the blogosphere. First put forth by British economist William Jevons in 1865, the Rebound Effect proposes that energy efficiency is counterproductive, because energy conserved in one sector is automatically put to use in another sector. Jevons’ theory was based on an energy economy that had only coal as a source material and industrial production was the main economic sector. But his argument has been repackaged and repurposed to cover micro as well as macro level impacts. Now it has been extended to question energy efficiency (and carbon emissions reduction) efforts in general.
In its 21st century incarnation, the Rebound Effect looks a bit different than it did in 19th century England, encompassing the increasingly diversified energy environment. As the New Yorker presents it, the incentives for conservation – often cost-savings – cancel themselves out by putting money in people’s pockets that they will inevitably spend on some other energy-intensive purchase.
But the New Yorker’s accounting is off. The reporter refers to a friend’s newly remodeled kitchen with enormous side-by-side refrigerators as an example of Rebound, suggesting that this is representative of the greater public. It is unlikely that this friend can afford double Sub Zero’s because he scrimped for many years prior on a super-efficient refrigerator and light bulbs. James Barrett at Real Climate Economics extensively debunked the argument. That wealthier people may refrigerate more food is interesting, but there is no evidence that it correlates to efficient technologies and conservation strategies.
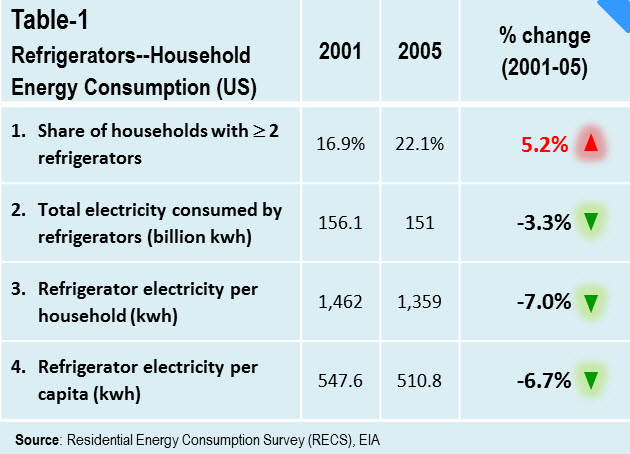 We wondered about the energy consumed by America’s ballooning refrigeration demands and researched using data from the US Energy Information Agency (EIA). The share of US households with two or more refrigerators increased by 5.2% between 2001-05. However, during the same period the total electricity feeding the growing refrigerator use declined by 3.3%, and on per capita and per household basis the decrease was nearly 7% (Table-1). In effect energy efficiency gains, which averaged 3.6% per year since 1990, was sufficient to cut total electricity consumed by refrigerators in US households. The same trend is true for Canada also where the total energy needed for household refrigerators declined by 42% since 1990. Unfortunately, the New Yorker chose to cite populist style anecdote on refrigerators rather than digging into hard data.
Refrigeration removed from the equation, we wondered whether households in general might increase energy intensity over time. Again, we found that energy intensity decreased fairly steadily, regardless of the price of energy, on a per-square-foot basis between 1980 and 2005. This is pictured in Exhibit-2A. We suspect that efficiency standards and technological advancements that cut energy use in residential heating, cooling, and appliance use is a major factor.
We found the same pattern in Canada, where residential energy efficiency programs have been in use since 1982. As shown in Exhibit-2B, residential energy intensity (GJ/m2) declined at an average annual rate of 1.36% in Canada even when the average household size increased over time. There is no doubt that bigger and modern washing machines, refrigerators, and sub-zero freezers are making their way into increasingly large houses in Canada, but on net energy efficiency programs and standards have still led to energy savings. A quick calculation demonstrates the result—if residential energy efficiency had remained stagnant at the 1990 level, Canadians would need an additional 400 million GJ or 111 million MWh of energy in 2008. That is equivalent to eliminating four of the largest power plants in the US.
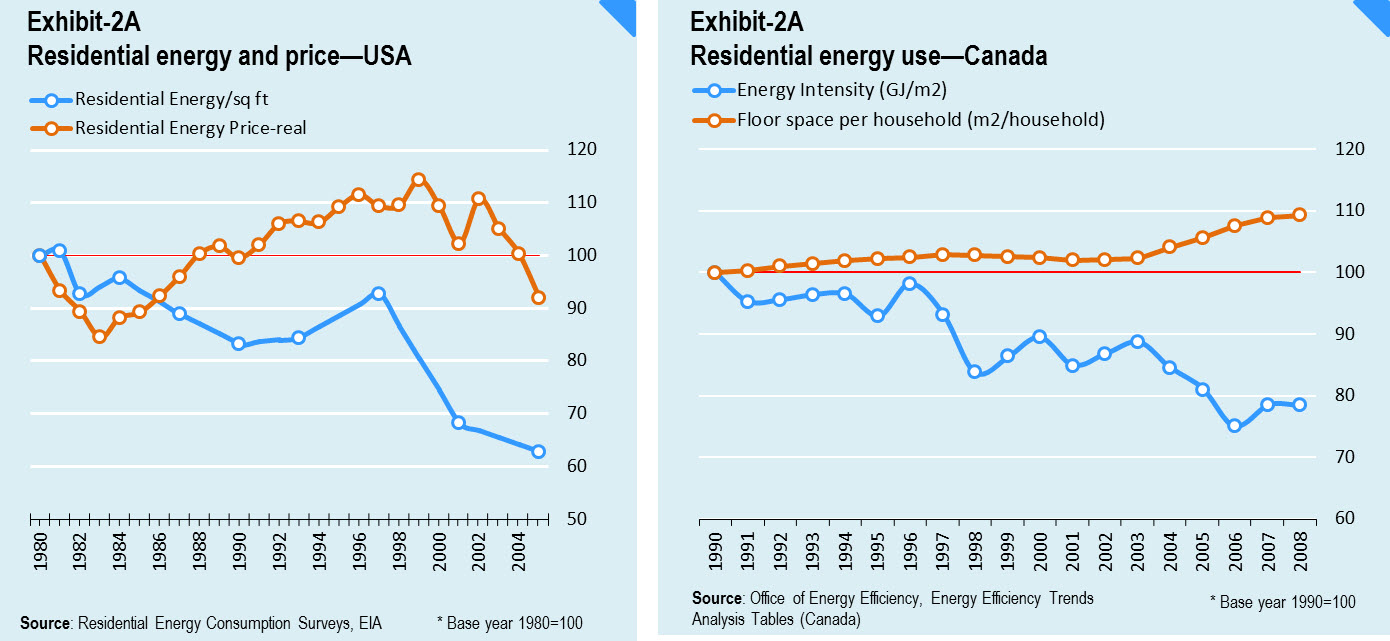 Yet the gains in energy efficiency failed to stem the increase in the total residential energy consumption in Canada, which grew at an average annual rate of 0.7% during 1990-2008. Could this be Rebound?
On the contrary the culprits for energy use increases are GDP (which increased by 1%) and population (which grew by 2%). If not for efficiency measures (including Canada’s nationwide residential energy efficiency program, R-2000 Standard, which has helped reduce per capita energy use at an average rate of 0.4% per year) total residential energy consumption in Canada would be much higher than 0.7% per year.
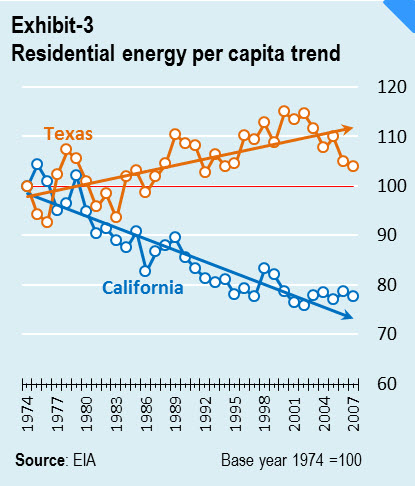
Ironically, the point is reinforced in the United States by similar data used in a Washington Post report to prove the limits of energy efficiency. National data shows that per capita average energy consumption in US homes has barely budged since 1970. But the average American home isn’t representative of energy efficiency measures, as comparative long term per capita residential energy trends of California and Texas show. California, which has aggressively followed efficiency programs to cut residential energy use, successfully reduced its residential energy use per capita an average of 0.9% per year. In comparison, Texas did not adopt energy efficiency programs and has seen an average increase of 0.4% per year (Exhibit-3). That the US per capita average for residential energy has remained stagnant suggests that US as a nation has failed to adopt energy efficiency programs uniformly across all states—a sign of policy weakness not energy Rebound.
 Our analysis contradicts the Washington Post, the New York Times and New Yorker storylines, and shows that the case for energy efficiency is rather straightforward and clear. Rebound is there but is in the range of 10-30% for households as reported in published literature (Greening et. al. 2000). And for transport, the Rebound effect from fuel efficiency improvements in the US is estimated to be around 10.7% based on the data covering the period 1997-2001 (Small and Dender 2007, WSJ 2009). This still leaves a net savings of 70-90% that can buck the trend of energy use per capita.
Energy efficiency works. But the real story is that it works best when governments proactively and whole-heartedly embrace energy saving policies and programs over and above the ongoing, often market driven, improvements in home appliances and other technologies.
The Rebound illusion—math doesn’t match the matter
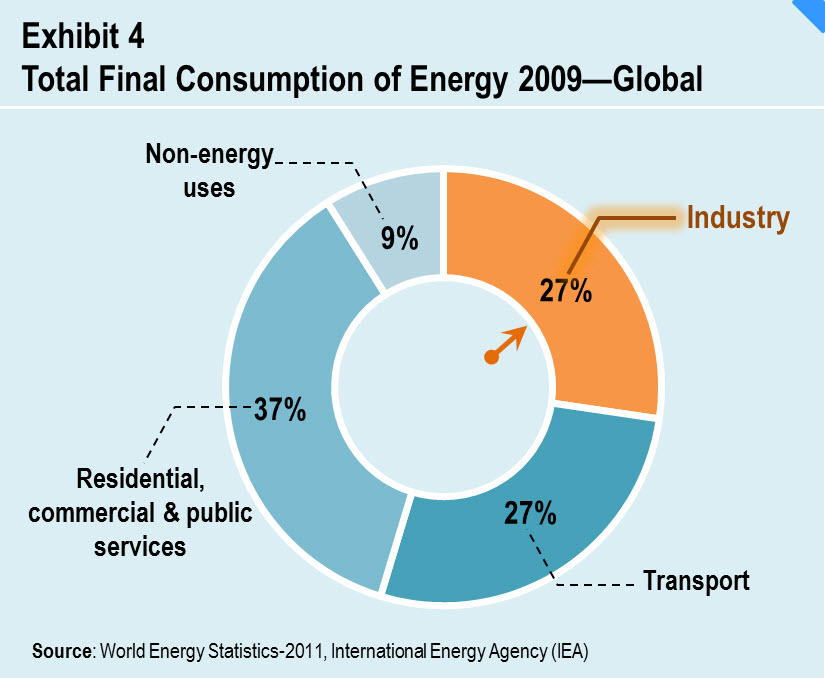
As discussed above, at a residential consumption level the evidence of an energy efficiency dilemma is weak; on the production side the empirics of Rebound are even weaker, though the claims are much greater. In fact, the BTI’s real beef with energy efficiency is on the production side, which they incorrectly claim accounts for “two thirds” of the global energy use (Exhibit-4).
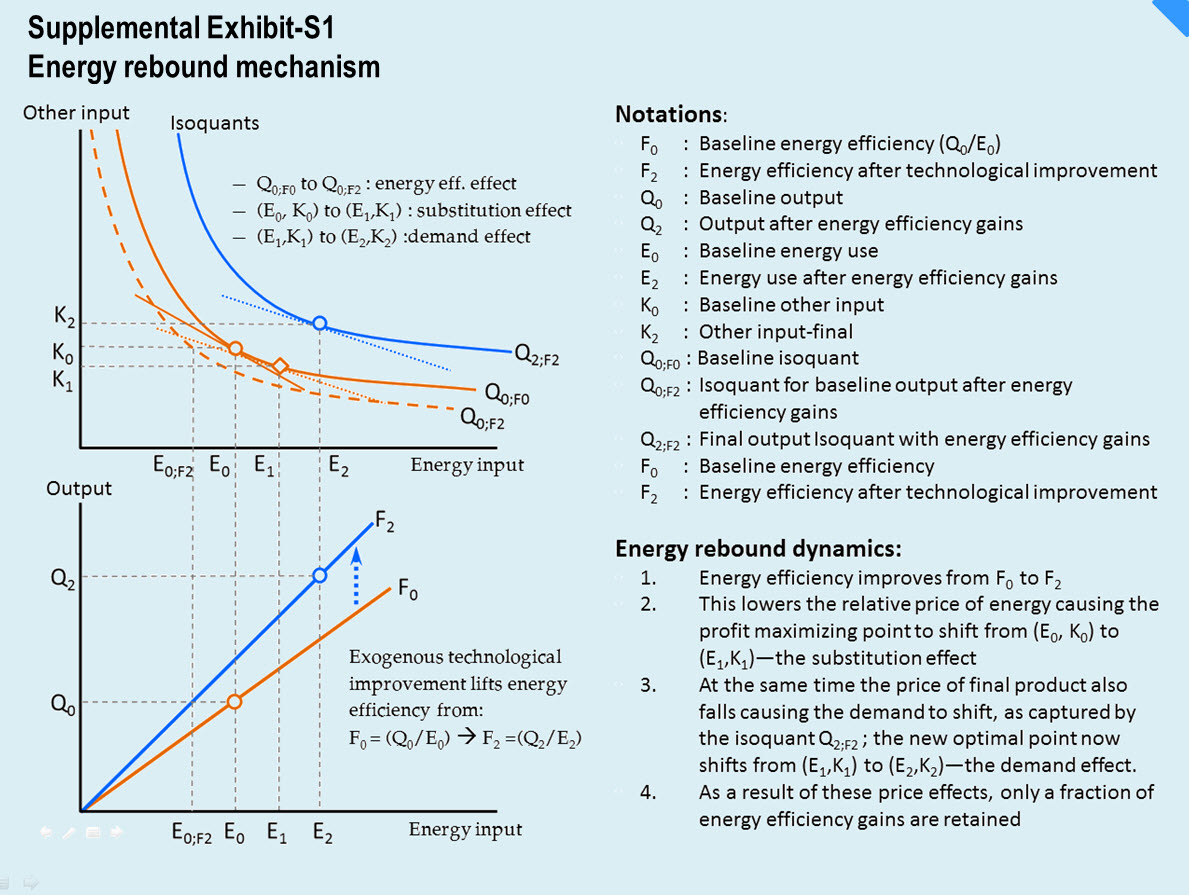
 Citing over-estimated production sector energy use, the BTI has forcefully asserted that the production sector and economy-wide Rebound effects can not only wipe out the entire savings from energy efficiency but in some cases can actually increase energy use—a phenomenon called backfire. The primary reference for this conclusion comes from an unpublished paper in 2010 by Dr. Harry Saunders, a Senior Fellow at the BTI. According to Saunders, extreme Rebounds happen due to two simultaneous effects—first efficiency reduces the relative price of energy creating incentives for producers to use more energy, termed the substitution effect. And second, it reduces the price of the final product which causes the demand to increase, which in turn leads to more energy use—the demand effect (Supplemental Exhibit-S1).
Previous efforts to link efficient energy use with firms’ inclination to pursue high-energy activities were estimated at around 0-20% (Greening, et al 2000), retaining 80-100% of the energy efficiency gains. But Saunders (2010) claims that energy efficiency gains in one sector has a chain effect on the entire economy, translating into Rebound of 60-100% or even more. These claims have been refuted by climatologists, journalists, policy advocates, and others, but we sought an additional layer of verification.
Accordingly, we decided to examine Saunders’ paper equation-by-equation, number-by-number. We found several shortcomings, two of which are discussed below. Additional shortcomings will be discussed in a forthcoming working paper by the CO2 Scorecard group. Our findings were so startling that it led us to conclude that Saunders’ estimate on Rebound are not just severely over-estimated but are downright wrong in many cases.
(1) Inconsistencies with real data: Perhaps most problematically, Saunders calculates Rebound in a number of economic sectors without including any specific discussion of the underlying technological change and engineering improvements that actually increased efficiency and triggered Rebound. He essentially regards the increase in energy use as a result of a (stated) increase in efficiency without providing a causal explanation or justification for his Rebound estimates.
In this regard, the Rebound estimates of two sectors caught our attention—metal mining and electric utilities. According to Saunders, metal mining has energy specific Rebound of 51% for the period 1991-2000. During the same period the Rebound for electric utilities is 120%—representing a situation of backfire. Such high energy-specific Rebound implies that energy efficiency gains have been quite pronounced in these sectors – a major reaction can only follow a major action.
In metal mining, estimates by Saunders show that Rebound is driven by energy efficiency improvements estimated to be 2.36% per year. This is contrary to the current reality and expected trend for metal mining; energy intensity is expected to worsen or remain stagnant over time as each mine extracts its metal from a lower grade ore at the margin (ore bodies have steadily declined in grade for decades, as high-grade ore-bodies have been depleted by mining). This fact is reaffirmed by the data on the energy intensity trend of the metal mining sector of Canada (Exhibit-5A), which as expected has remained more or less steady since 1990.
Canada’s data apply well to the US mining sector’s situation, where the benchmark energy intensity is almost identical to Canada’s at 0.36 TJ/kilo-tonne (DoE 2007) compared to Canada’s average of 0.35 TJ/kilo-tonne. Given the convergence of markets and technology, US metal mining is expected to have a similar trend, which begs the question: If metal mining typically suffers from falling or stagnant energy efficiency then where is the Rebound coming from in Saunders’s paper? In a careful examination of the paper we could find no evidence-based support for Saunders’ efficiency estimate.
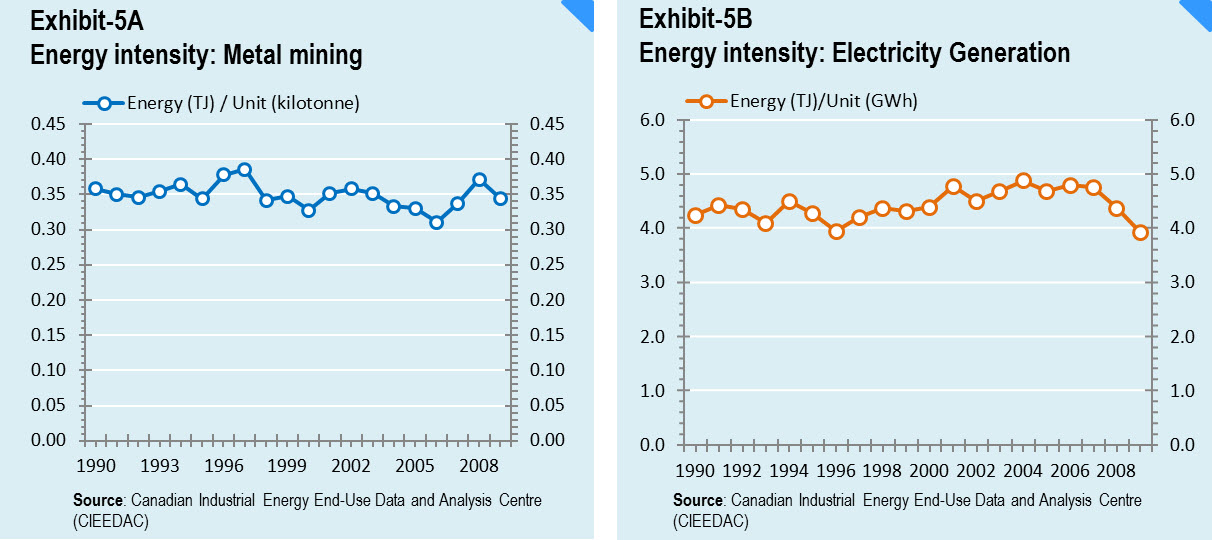 Saunders’ estimates for electric utilities were equally unsupportable, given the industry’s stagnant (and sometimes negative) energy efficiency trends over time. Because electricity generation technology has a long life span, once installed a production system remains locked-in for 40-50 years. These technologies come with fairly advanced control and automation systems that leave little room for year-to-year technological improvement. Furthermore, with the advent of environmental regulations and tighter air emissions standards auxiliary energy consumption (to power scrubbers, fans, pumps and other control gear) increases in existing, aging power generation facilities, making them less, not more, energy efficient, even as they become “cleaner”. At best, energy intensity will remain stagnant. Canadian power generation and energy efficiency data demonstrate this stagnation (Exhibit-5B).
If energy efficiency improvements are near zero in the metal mining and electric utilities, their energy specific Rebound should also be near zero. Saunders’ estimates, of 51% and 121% respectively, contradict the technological reality and defy logic.
Even in cases where there are genuine improvements in energy efficiency, Saunders’ estimates appear to be exaggerated. In the case of primary metal covering steel production, Saunders estimates energy efficiency gains of 2.9% driven by the electric arc furnace technology (which was introduced in the US in the 70s). However, a US Department of Energy report (Stubbles 2000) shows that the steel sector’s energy intensity fell from 20 to 18 MBtu per ton amounting to only 1.3% per year change during 1990-98, considerably less than the rate of improvement estimated by Saunders. This is indicative of overestimation, which automatically translates into high energy-specific Rebound like the 66% estimated by Saunders.
Saunders’ empirical errors and discrepancies raise fundamental questions about the empirical methodology his paper uses to quantify “vintage effects”—the technological improvements that affect energy efficiency in a production sector. His results are not just over-estimated but are likely to be out of sync with the reality of technology trends, raising questions about the validity and accuracy of the entire paper.
(2) Deficiencies in the model: Even if Saunders efficiency estimates aligned with real-world efficiency gains, there would still be major concerns with the theoretical model he employed, which does not capture the real world economics of production decisions of industrial organizations. Many factors that affect the model parameters and prices like labor unions, corporate vision, social norms, strategic behavior, incomplete information, unexpected technological breakthroughs and others are excluded. Instead, Saunders’ model is a generic and simplistic one with a mathematical architecture that by design is only capable of producing results that show increasing demand for factors of production whenever there is an improvement in its productivity or efficiency. So if capital becomes more productive, there will be more investment; if energy efficiency improves there will be more energy use—this is pre-determined by the interplay of equations and assumptions in the model.
The present unemployment rate in the US economy puts his theory in doubt. According to Saunders’ model, improvement in labor productivity will lead to more demand for labor through the same rebound mechanism put forth for energy efficiency. If this were true, governments worldwide would be grateful – unemployment would be at all-time lows, given the latest worker productivity data. But observed economics works differently—for the past few years improvements in labor productivity in the US have barely dented the unemployment rate.
The fact is that Saunders’ and other such multi-sectoral and economy-wide models of rebound (Hanley 2009, Turner 2009 and Turner & Hanley 2011) are too simplistic and stylized for the task at hand. Blind faith in the results of such mathematical models is risky, and as emerging evaluations show there are important lessons to be learnt for policy analysis (IMF-Independent Evaluations Office 2011, Chapter-4/para-46). We don’t want to imply that Saunders’ statistical technique or other economy-wide models should be discarded, but their results need deeper validation and fact-checking before pitching it for policy decisions.
Three cheers for energy efficiency
Disproving the anti-energy efficiency literature is not enough to do away with Rebound. We must positively prove that energy efficiency policies are quite capable of cutting energy use per capita, and should remain an instrument of choice for governments.
To validate energy efficiency as a desirable policy measure, we must begin with the most credible policy data. The best evidence of this is provided by the energy efficiency policy scorecard of the American Council for Energy Efficient Economy (ACEEE), which we statistically analyze for energy use per capita.
The ACEEE energy efficiency scorecard uses a comprehensive evaluation framework covering public utility programs, transportation policies, energy-efficient building codes, combined heat and power, appliance efficiency standards and state government initiatives (financial incentives, government greening, and eco R&D). It is designed to measure the quality of energy efficiency policies at the state level in the US.
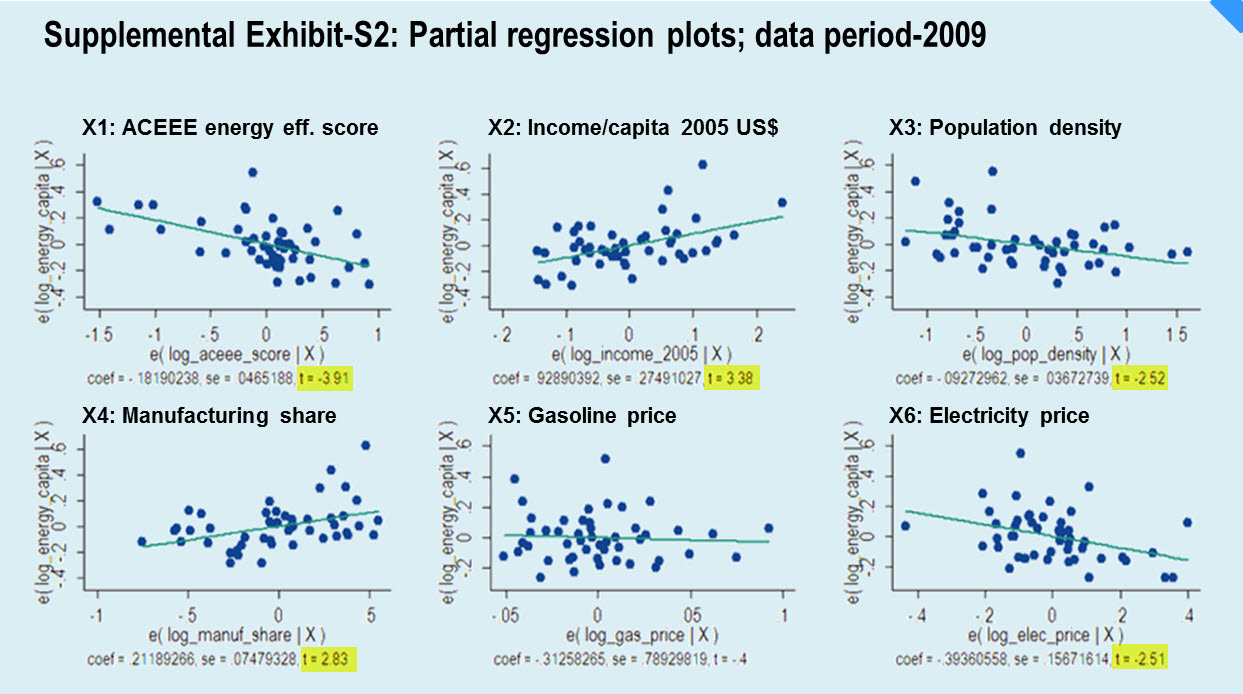
Controlling for factors like electricity and gas prices, per capita income, variations in weather patterns, population density and economic structure, we used a multiple regression model (described in Appendix-1) to statistically verify if the quality of energy efficiency policies as measured by the ACEEE is associated with lower energy use per capita.
Using ACEEE’s 2009 data, we found that a 1% improvement in ACEEE’s energy efficiency score leads to an estimated 0.18% decrease in energy use per capita at the state-level in the US. This is visualized in Exhibit-6 as a downward sloping line depicting the long run average correlation between energy efficiency policy score and energy use per capita. As discussed in Appendix 1, a similar relationship between ACEEE’s energy efficiency score and energy per capita exists for the years 2007 and 2008. This finding confirms that the causal relationship between energy efficient policies and energy use per capita is not a one-year phenomenon but is consistent and statistically significant over time.
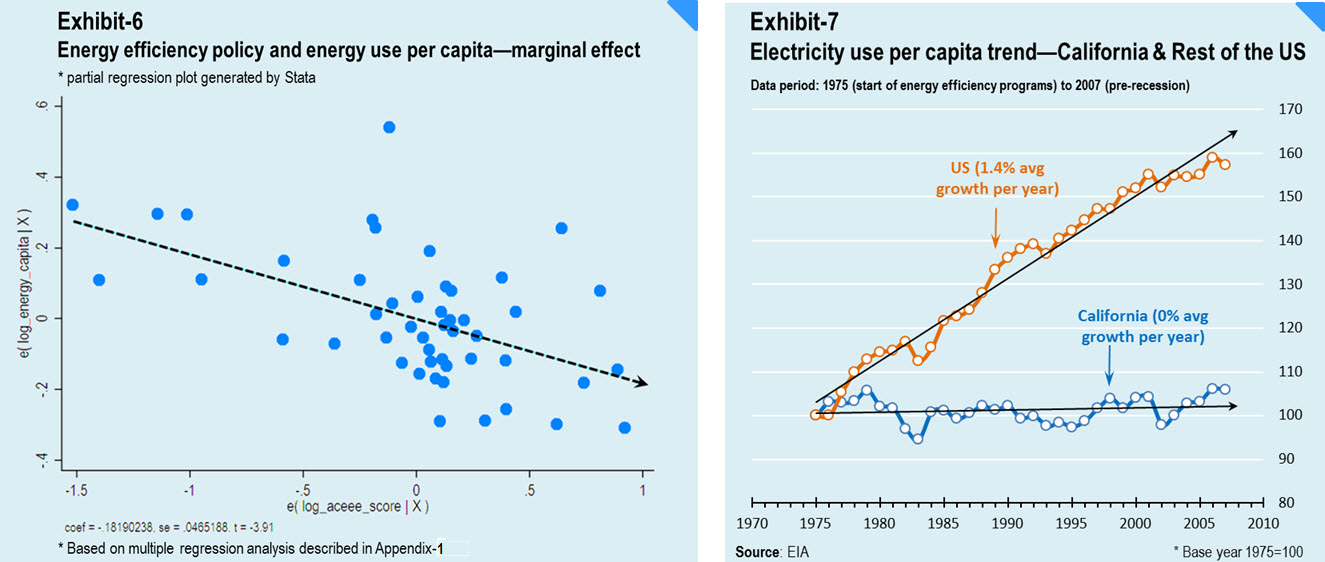 These new findings verify what the US Energy Information Administration has been putting forth for over a decade: energy efficiency policies are central to cutting emissions. Just last year the EIA published estimates on building efficiency improvements using best available technologies, but the agency noted that even with the best technology, policies would still need to be in place to promote efficiency. Data further confirm these findings—as shown in the Exhibit-7, California, which is among the most energy efficient states and has pursued efficiency policies since 1974, was able to put a lid on the average per capita electricity consumption for over three decades—in comparison electricity use per capita increased at an annual rate of 1.4% for the rest of the US. If Rebound effects were as rampant as claimed by the Breakthrough Institute, we would not find a robust relationship between energy efficiency policies and lower electricity use per capita trend.
None of this is to say that Rebound is not happening; given that energy use is so pervasive in our economy both energy Rebound and energy conservation occur simultaneously and constantly. But, as our data analysis indicates, on net the policies that encourage energy efficiency create incentives for energy conservation that ultimately outweigh the effect of energy Rebound, leading to comparatively lower energy use per capita. Total energy use may still increase due to population growth and economic expansion, but without energy efficiency these increases will be much larger.
Journalists and researchers—a note of caution!
For journalists, the Rebound Effect is a trap—it is a man-bites-dog story that never happened. Counter-current climate change reporting is enticing but requires careful analysis. The journalists caught up in the allure of Rebound made two key mistakes—first they used anecdotes to anchor their core message, and second they ignored the voices of leading energy efficiency experts. One man’s refrigerator is not another man’s climate crisis, but it does create a narrative that leaves readers, the energy consumers, wondering about the usefulness of energy efficiency. Reporters should heed experts who are widely recognized for their understanding of energy efficiency, like Dr. Amory Lovins of the Rocky Mountain Institute and Mr. Skip Laitner of the American Council for an Energy-Efficient Economy. Unfortunately Dr. Lee Schipper of Stanford passed away in August 2011, a leading energy efficiency expert whose insights were ignored by a spate of reporters.
Particularly for energy efficiency, journalists have a special responsibility. New emerging research by Harvard and MIT/NYU economists confirm that non-price approaches like information provision and social norms can successfully influence consumer choices towards a more energy efficient lifestyle (Allcott and Mullainathan 2010 and Dietz 2010). Empirical analysis built on this thesis confirmed that informational awareness cut residential electricity use by as much as 2%, an impact that is equivalent to increasing the price of electricity by 11-20% (Allcott 2011). Such results underscore the importance of disseminating reliable and accurate information on energy efficiency, and journalists are well positioned to promote this effort—but it will require responsible and well researched reporting.
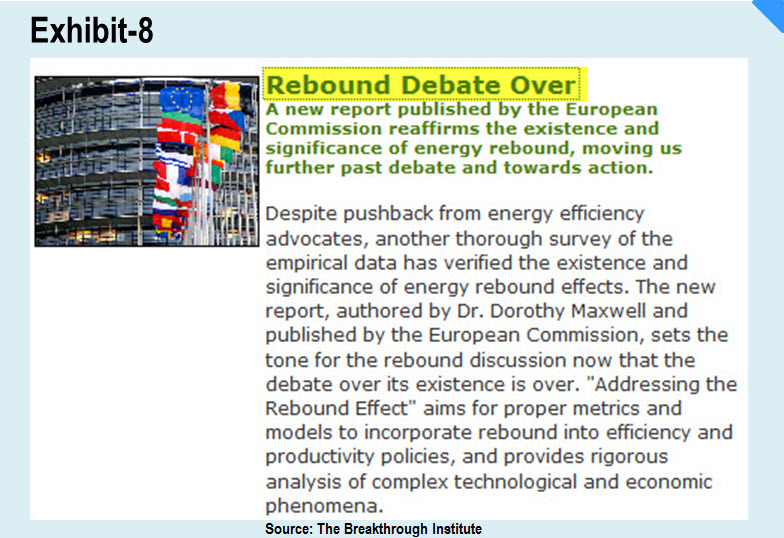 Consultants, too, have contributed to mis-communication—the case in point is a European Commission report. This report not only failed to conduct a thorough review of Saunders 2010, but it took its findings at face value and treated it at par with published papers and government reports—a case of false equivalence in literature review that ended up over-stating the incidence of energy Rebound. As shown in Exhibit 8, this was quickly seized by the BTI to declare that “Rebound debate is over”.
The policy implications of such mistakes are serious—effective instruments like energy efficiency will be underused even more and, and worsen the problem of energy-efficiency gap, a situation characterized by under-valuation of energy costs and less than optimal use of energy efficient products and services. Recently this phenomenon was empirically affirmed by economists (Allcott and Wozny 2011) as well as engineers, sociologists and psychologists (Attari et al. 2010).
Policy messages
Rebound, we agree, occurs constantly. As established in 2000, and noted above, Rebound is estimated to be in the range of 10-30% for residential and transportation sectors, 0-20% for industries, and indirect economy-wide effects remain small—these estimates still hold in 2012. There is no need to revise these estimates upwards, because the new research promoted by the BTI lacks the necessary empirical credence. The bottom-line is clear—if energy efficiency can retain 70-100% of the savings on net, that’s not a bad deal. Given that energy efficiency programs are below-cost or low-cost, and can take us up to 25-40% GHG abatement, there are good reasons to retain energy efficiency as an essential component of the overall climate policy mix.
Our own findings show that ACEEE’s energy efficiency scorecard is a very useful methodology for capturing the quality of energy efficiency efforts of governments. Such approaches should be strengthened and disseminated in developing countries where energy efficiency potential can be tapped early on in the income growth cycle. Further, it is worth emphasizing that to get a full picture of energy efficiency, ACEEE’s approach shows that analysis of policies and programs should be comprehensive covering utilities, buildings, transport, appliances and other aspects—and it is misleading to reduce or compartmentalize such an analysis to a single appliance or just the building codes.
Finally, the world needs more energy efficiency—not less (Luoma 2011). This is the salient finding of new and emerging multi-disciplinary research on energy-efficiency gap. If energy efficiency is not leading to anticipated reductions in energy use, it is due to inadequate adoption of energy efficient products and services, not the Rebound Effect. Governments, therefore, need to apply both non-price and price-based strategies broadly across supply-side and end-use sectors to promote energy efficiency.
Implications for the Breakthrough Institute (BTI)
Thrusting Energy Rebound into climate policy discussions in a way that it pits one policy against the other is a distraction. We believe that the BTI-led anti-energy efficiency campaign hurts our collective effort to develop a comprehensive climate policy framework. By promoting insufficiently reviewed literature that undermines policy solutions to climate change, the BTI is putting tried-and-true ideas into silos.
The BTI’s position on energy efficiency aligns with its overall intellectual approach reflected in from the group’s 2004 “The Death of Environmentalism”, and its more recent 2010 “Post-Partisan Power” and 2011 “Climate Pragmatism.” BTI seeks to be a voice apart from the environmental movement, but its commitment to unique approaches seems to have overridden its commitment to fact. The myopia of Rebound is a microcosm of the narrow perspective taken by proponents of “climate pragmatism” in general. To be pragmatic about climate change, we must tackle it head on; bickering about what policy would be best diverts attention from the essential. The best method for mitigating climate change is a mix of all policies. Rebound tried to remove energy efficiency from the mix; climate pragmatism removes more. Our forthcoming research note will offer a detailed critique of Breakthrough’s climate pragmatism.
Conclusion
Rebound or no rebound, energy efficiency works!
Q.E.D.
References
Allcott H. (2011), “Social norms and energy conservation”, Journal of Public Economics, 95, pp. 1082-1095, March 2011.
Allcott H. and Mullainathan S. (2010), “Behavior and Energy Policy”, Science, 327, March 2010.
Allcott H. and Wozny N. (2011), “Gasoline Prices, Fuel Economy, and the Energy Paradox”, July 2011.
Attari S.Z., DeKay M.L., Davidson C.I., de Bruin WB (2010), “Public perceptions of energy consumption and savings”, Proceedings of the National Academy of Sciences USA 107:16054–16059, September 2010.
Barrett J. 2011, “Rebounds and Jevons: Nobody Goes There Anymore. It’s Too Crowded”, Real Climate Economics, January 18, 2011.
Barrett J. 2011, “Rebounds Gone Wild”, Real Climate Economics, January 10, 2011.
Bialik C. 2009, “To Gauge Oil Savings, Economists Road Test the 'Rebound Effect'”, The Numbers Guy, The Wall Street Journal May 27, 2009.
Breakthrough (2011), “Climate Pragmatism: Innovation, Resilience and No Regrets”, (2011), Breakthrough Blog, Breakthrough Institute, July 2011.
BP, “BP Energy Outlook 2030”, British Petroleum, January 2011.
Brookes L. (1990), “The greenhouse effect: the fallacies in the energy efficiency solution”, Energy Policy, 18 (2), pp. 199-201, March 1990.
Carey J. (2010), “The Efficiency Catch-22”, Conservation Magazine.
Chameides B. (2011), “Energy Efficiency on the Rebound”, Huff Post Green, March 2011.
Dietz T., “Narrowing the US energy efficiency gap”, Proceedings of the National Academy of Sciences USA vol. 107:16007–16008, September 2010.
DoE 2007, “Mining Industry Energy Bandwidth Study”, prepared by BCS Incorporated for the U.S. Department of Energy, Industrial Technologies Program, June 2007.
EIA (2002), “Measuring Changes in Energy Efficiency for the Annual Energy Outlook 2002”, U.S. Energy Information Administration, 2002.
EIA (2010), “Annual Energy Outlook 2010 with Projections to 2035”, (2010), U.S. Energy Information Administration, 2010.
Fahrenthold D. A. (2010), “Are American homes more energy efficient? Not exactly.”, The Washington Post, September 2010.
Goldstein D.B., Martinez S. and Roy R. (2011), “Are There Rebound Effects from Energy Efficiency?—An Analysis of Empirical Data, Internal Consistency, and Solutions”, Electricity Policy, May 2011.
Greening L.A., Greene D.L. and Difiglio C. (2000), “Energy efficiency and consumption—the rebound effect—a survey”, Energy Policy, 28 (6-7), pp 389-401, June 2000.
Hanley N., McGregor P. G., Swales J. K. and Turner K. (2009), “Do increases in energy efficiency improve environmental quality and sustainability?”, Ecological Economics, 68 (3), pp. 692-709, January 2009.
IMF-Independent Evaluations Office (2011), “IMF Performance in the Run-Up to the Financial and Economic Crisis: IMF Surveillance in 2004-07”, Chapter 4, para-46, International Monetary Fund, 2011.
IEA (2010), “Energy Technology Perspectives 2010”, International Energy Agency, 2010.
Jaffe A.B. and Stavins R.N. (1994), “The energy-efficiency gap”, Energy Policy, 22 (10), pp. 804-810, 1994.
Jenkins J. (2011), “FAQ: Rebound Effects and the "Energy Emergence" Report”, Breakthrough Institute, March 2011.
Jenkins J., Nordhaus T. and Shellenberger M. (2011), “Energy Emergence Rebound & Backfire as Emergent Phenomena”, Breakthrough Institute, February 2011, Oakland CA.
Luoma J. R. (2011), “Why Does Energy Efficiency’s Promise Remain Unfulfilled?”, Environment 360, February 2011.
Maxwell, D., Owen, P., McAndrew. L, Muehmel, K., Neubauer, A. (2011), “Addressing the Rebound Effect”, European Commission DG ENV, Bio Intelligence Service, April 2011.
McKinsey Global Institute (2008), “The Carbon Productivity Challenge: Curbing Climate Change and Sustaining Economic Growth”, McKinsey & Company, June 2008.
Nature-Editorial (2011), “On the Rebound”, Nature, 470, pp. 435-436, February 2011.
Owen D. (2010), “The Efficiency Dilemma”, The New Yorker, December 2010.
Hawksworth J. (2006), “The World in 2050: Implications of global growth for carbon emissions and climate change policy,” PriceWaterhouseCoopers, September 2006.
Romm J. (2011), “Rebound effect: The Breakthrough Institute’s attack on clean energy backfires”, Climate Progress, February 2011.
Saunders H. D. (2010), “Historical Evidence for Energy Consumption Rebound in 30 US Sectors and a Toolkit for Rebound Analysts”, Breakthrough Institute, November 2010.
Saunders H. D. (2011), “Six Misconceptions about Rebound and Backfire”, Breakthrough Blog, Breakthrough Institute, January 2011.
Saunders H. and Jenkins J. (2011), “Rebound and Rigor: NRDC's Entry into Rebound Effect Debate Stuck in the Past”, Breakthrough Blog, June 2011.
Sciortino M. (2010), “What Makes a State Energy Efficient?”, American Council for an Energy-Efficient Economy, October 2010.
Shellenberger M., Nordhaus T. and Jesse Jenkins (2010), “The Efficiency Illusion”, Breakthrough Blog, December 2010.
Shellenberger M. and Saunders H. (2010), “Why Energy Efficiency May Not Decrease Energy Consumption”, Breakthrough Blog, September 2010.
Small K. A. and Dender K. V., “Fuel Efficiency and Motor Vehicle Travel: The Declining Rebound Effect”, International Association for Energy Economics, 28 (1), pp 25-52.
Sorrell S. (2007), “The Rebound Effect: An Assessment of the Evidence for Economy-Wide Energy Savings from Improved Energy Efficiency”, Sussex Energy Group for Technology & Policy, UK Energy Research Center, October 2007.
Stubbles J. (2000), “Energy Use in the U.S. Steel Industry: An Historical Perspective and Future Opportunities”, report for the U.S. Department of Energy, Office of Industrial Technologies Washington, DC, September 2000.
Tierney J. (2011), “When Energy Efficiency Sullies the Environment”, The New York Times, March 2011.
Tollefson J. (2011), “Experts tangle over energy-efficiency ‘rebound’ effect”, Nature, February 2011.
Trembath A. (2011), “European Commission Publishes Report Warning Policymakers to Attend to Rebound Effects”, Breakthrough Blog, October 2011.
Turner K. (2009), “Negative rebound and disinvestment effects in response to an improvement in energy efficiency in the UK economy”, Energy Economics, 31 (5), pp. 648-666, September 2009.
Turner K. and Hanley N. (2011), “Energy efficiency, rebound effects and the environmental Kuznets Curve”, Energy Economics Volume 33, Issue 5, September 2011, Pages 709-720.
Woodside C. (2011), “Energy Efficiency and the ‘The Rebound Effect’”, The Yale Forum on Climate Change and the Media, March 2011.
Supplemental Exhibits
Data Notes: Calculation of average annual growth rate
The average annual growth rates for energy use indicators that are cited in the research note are estimated as follows: the compound growth rate equation for a variable X is: Xt = Xo (1 + r)t where t represents time. The logarithmic transformation gives Ln(Xt) = Ln(Xo) + Ln(1+r)•t, which translates into a linear regression equation of the form Ln(Xt) = α + β•t, where parameter β = Ln(1+r). The regression estimate of the parameter β is β* = Ln(1 + r) or r, the average annual growth rate is [exp(β*) − 1]. This methodology is applied when there is a continuous time series.
Appendix-1: Regression model and results
Regression Model: Ln(Y) = α + ∑βi•Ln(Xi) + ε
|
VARIABLES
|
2009 results
|
2008 results
|
2006 results
|
|
log_Energy_capita Ln(Y)
|
log_Energy_capita Ln(Y)
|
log_Energy_capita Ln(Y)
|
|
Xi
|
Description
|
βi
|
βi
|
βi
|
|
X1
|
Ln_ACEEE_score
|
-0.182***
|
-0.129**
|
-0.124***
|
|
|
|
(0.0465)
|
(0.0484)
|
(0.0440)
|
|
X2
|
Ln_manuf_share
|
0.212***
|
0.209**
|
0.243***
|
|
|
|
(0.0748)
|
(0.0882)
|
(0.0889)
|
|
X3
|
Ln_pop_density
|
-0.0927**
|
-0.0943**
|
-0.136***
|
|
|
|
(0.0367)
|
(0.0413)
|
(0.0409)
|
|
X4
|
Ln_income_2005
|
0.929***
|
0.422
|
0.806**
|
|
|
|
(0.275)
|
(0.359)
|
(0.339)
|
|
X5
|
Ln_gas_price
|
-0.313
|
-0.552
|
-1.333
|
|
|
|
(0.789)
|
(1.377)
|
(1.298)
|
|
X6
|
Ln_elec_price
|
-0.394**
|
-0.203
|
-0.189
|
|
|
|
(0.157)
|
(0.160)
|
(0.154)
|
|
X7
|
Ln_hdd_cdd
|
-0.0390
|
-0.0912
|
-0.241
|
|
|
|
(0.137)
|
(0.151)
|
(0.184)
|
|
α
|
Constant
|
-0.978
|
4.905
|
4.407
|
|
|
|
(2.994)
|
(5.512)
|
(4.627)
|
|
|
|
|
|
|
|
|
Observations
(excludes Alaska and Hawaii)
|
48
|
47!
|
48
|
|
|
R-squared
|
0.766
|
0.593
|
0.645
|
|
|
Standard errors in parentheses
|
|
|
|
|
|
*** p<0.01, ** p<0.05, * p<0.1
|
|
! Wyoming was dropped because ACEEE score =0
|
|
*Additional regression notes: In this research note we focused on the effects of ACEEE’s energy efficiency score on per capita energy use, but other factors like population density have interesting effects too—energy use falls where population density is high, high income increases energy use and energy price rises seems to decrease use. Running the same regression model for 2008, during the period of recession in the US, regression indicates that energy consumption is not influenced by per capita income that year. This could be caused by recession fears, when people across the board changed their consumption behavior and income got temporarily delinked from energy use. We plan to explore these issues in more detail in our future research.
 Data sources for the regression model