CO2 Discrepancies between Top Data Reporters Create a Quandary for Policy Analysis
Written by: Shakeb Afsah and Michael Aller • Aug 28, 2010
Topic: CO2 Data Quality
[This research note was featured in "
The Carbon Numbers Game", Bloomberg Markets, January 2011;
pdf]
[UPDATE Sep 28, 2010: Following the release of this research note, the International Energy Agency (IEA) raised some concerns that get to the heart of the methodological and data issues behind the national CO2 emissions inventory system. Please read and follow the discussion here]
Executive Summary
A review by the CO2 Scorecard Group has revealed substantial discrepancies between the top publicly available global databases of CO2 emissions. Differing methodologies and the use of back-end data have produced data sets with wildly divergent CO2 emissions estimates for monitored countries. These discrepancies are so great that they dwarf the annual reduction targets generally proposed under cap-and-trade programs, the Kyoto protocol and negotiations surrounding the UN Framework Convention on Climate Change. Our findings are based on the analysis of 2009 CO2 emission estimates reported by BP and PBL-Netherlands.
If some of the best available data sources are so discrepant with each other , it creates a real dilemma for policy analysis and a problem for managing human-induced climate change. With inadequately standardized methods for monitoring CO2 emissions, there is no way to verify the year-over-year impact of emissions mitigation programs at the national level. Many governments could go years claiming emissions reductions, merely by changing methodologies for measurement. Greater attention, standardization, empirical testing and third party audit of estimation methodologies is necessary to create a CO2 emissions reporting infrastructure that is able to support verification of impacts from efforts to reduce overall CO2 emissions at the national and global level.
DISCLAIMER: The views and opinion expressed in this note should be attributed only to the authors and the CO2 Scorecard Group. We are thankful to Thomas Damassa of the World Resources Institute, Washington DC for his helpful comments. We also want to thank our colleagues Kendyl Salcito and Ted Burns for their ideas and input.
Download pdf
Full Report
Discrepancies in Estimates of 2009 CO2 Emissions
Updates to the CO2Scorecard Group’s CO2 emissions and energy use database this month reveal considerable discrepancies between two important public data providers. The Netherlands Environmental Assessment Agency (PBL) and BP’s Statistical Review of World Energy (2010) provide wildly disparate depictions of carbon emissions, creating doubt as to whether either data source is appropriate for policy analysis, or evaluation of baseline emissions and trends.
To compare the CO2 estimates of PBL-Netherlands and BP, CO2Scorecard matched the national data on 2009 emissions for 23 nations recognized as large emitters (see below). The total discrepancy in the estimates of CO2 emissions between the two sources add up to around 2 billion metric tons (see column [F]—the sum of under-estimates and over-estimates, excluding cement sector CO2; see data notes for details).
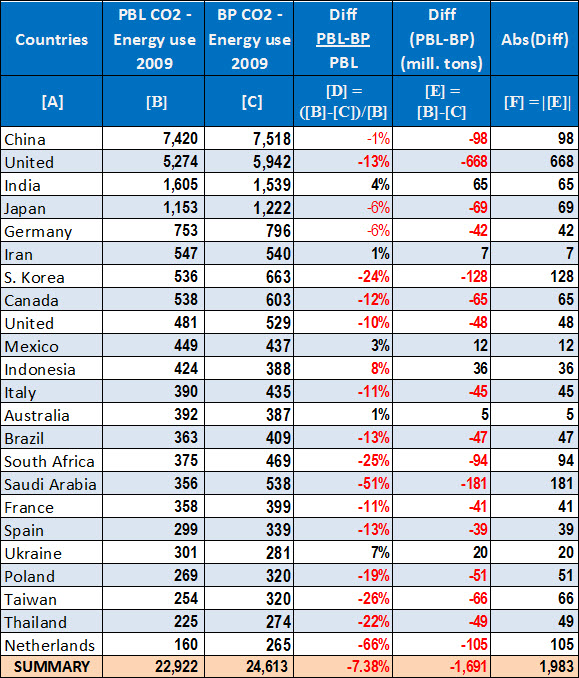
This creates an alarming specter. CO2 emissions are going under-measured in some countries, while other countries are apparently racking up millions of tons of phantom CO2. At the country level, there are some eye-popping differences. In the Netherlands, BP’s estimate for CO2 emissions is 66% larger than PBL’s for 2009—a discrepancy of 105 million tons of CO2. PBL’s estimate for Saudi Arabia is 51% lower than BP’s – a discrepancy of 181 million tons of CO2. The discrepancy for the US is 678 million tons or 13 percent, and for South Korea there is a 24% difference adding up to 128 million tons.
The discrepancies are not the only surprising feature of the 2009 data set: in China what’s shocking is the consistency. Estimates of China’s 2009 CO2 emissions from the two sources are only 1.33% different. This is puzzling because expert opinion assigns an uncertainty range of 15-20 percent for China’s data compared to around 3-5 percent for the US.[i]
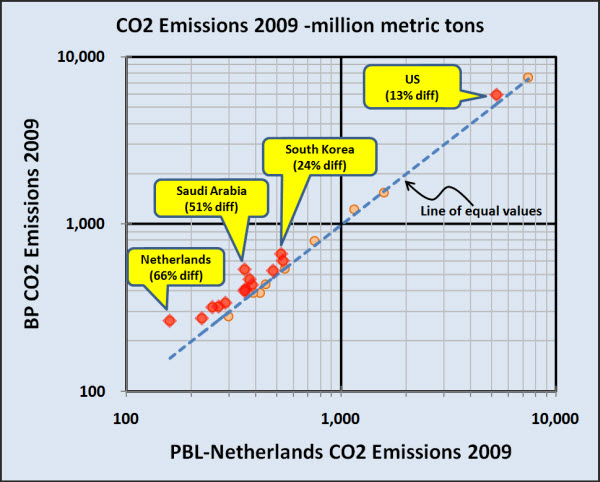
These differences suggest that the existing methodologies for measuring and reporting CO2 emissions at the national level are simply broken, and there is a need for serious standardization. Such major discrepancies can easily undermine the viability of global CO2 reduction initiatives.
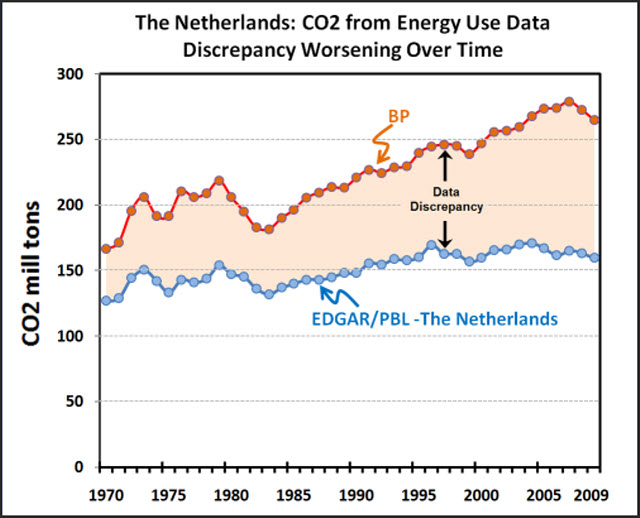
A closer look at the Netherlands’ data on CO2 emissions from energy use reveals that the data discrepancy between BP and EDGAR/PBL has worsened over time. If the discrepancy rate between these two sources had remained steady, it would perhaps have been evidence of consistent use of inconsistent conversion factors. But the discrepancy appears to be worsening for the Netherlands, which indicates deeper methodological concerns. One would expect an OECD country like the Netherlands to have consistent data on energy use for all international organizations that report CO2 emissions. But as shown in the chart, consistent estimates of CO2 emissions have eluded the top data reporters.
Additional Data Sources Show Similar Discrepancy
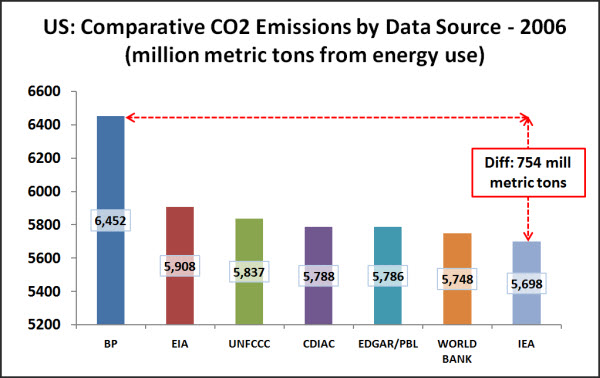
The problem is not unique to these two data reporters. The US data for 2006, drawn from seven major sources (BP, CDIAC, EIA, IEA, UNFCCC, World Bank, and PBL/EDGAR) showed a 10 percent difference between the maximum (BP) and the minimum (IEA) estimates. As shown in the chart, the disparity amounted to 754 million tons for the year. Policy advancement is crippled by these errors. Most national CO2 emissions targets are built on an annual reduction rate of around 1-2 percent. Even excluding the largest outlier (BP), the disparity of estimates for the US alone is over twice this rate. The rate of proposed emissions reduction is small enough in relative terms to enable many countries to show committed reductions simply by tweaking the methodology for measurement.
Experts assert, rightly, that perfectly consistent estimates of CO2 emissions are unattainable, but the current system is too flawed to be credible. Not only does it enable countries to fudge their actual emissions reductions, it has already resulted in some nasty political disputes. China recently challenged the energy use estimates of the IEA, calling it “not very credible.” If energy use data are challenged, it automatically raises concerns about national CO2 estimates.

Root Causes
It’s not that our technical expertise is limited, but several exogenous factors often interfere with the effort to generate reliable estimates of CO2 emissions. Based on our decade long experience of implementing environmental and energy use data collection and reporting systems in many countries and large corporations, we have learnt that deeply rooted institutional and political incentives make reporting entities unwilling to address issues of quality control.
There is also a need to improve and standardize the various conversion factors and these concerns are well articulated in a recent paper (Macknick 2009):
“Carbon emission estimates are based directly on energy use statistics. Unfortunately, there is great unrecognized uncertainty and differences among organizations that independently report energy use statistics. International energy data reporting organizations include different energy sources, utilize different calorific contents of fossil fuels, and utilize different and inconsistent primary energy equivalencies in their annual statistics. Thus although British Petroleum (BP) and the US Energy Information Administration (EIA) report identical quantities of barrels of oil consumed in 2005, the energy content reported differs by over 11%, or 18 Exajoules, roughly double the primary energy supply of the United Kingdom.”
Clearly, there are systematic causes that are behind these large differences in the country level data reported by national and international organizations. And quick fixes are unlikely because the intensifying climate politics would only be a hurdle to reforming data reporting and auditing systems.
Policy Implications
Simply put, we know that CO2 emissions are on the rise, but we really don’t know how much CO2 is added to the earth’s atmosphere every year. As we inch closer to making hard decisions about cutting CO2 emissions, such unreliable data could hamper the discussions about climate policy actions. The climate policy debate is already riddled with misinformation; if we don’t get our national and international system for CO2 monitoring and reporting right, concrete actions to reduce CO2 emissions will be further rescinded, reworked and delayed. Just knowing the trend of CO2 emissions is not good enough—we need to have reliable quantitative account of CO2 emissions to tackle the challenge of human induced climate change.
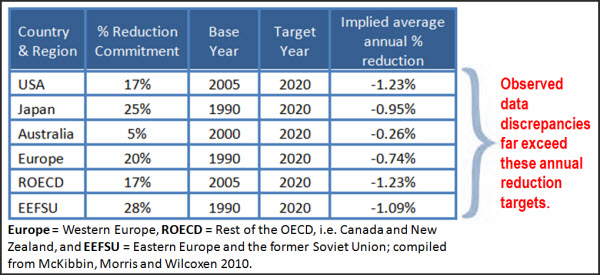
Policy implications are quite serious because the empirical discrepancies in the current annual CO2 emissions estimates far exceed the annual reduction targets generally proposed by policy instruments like the cap-and-trade program or national commitments. As shown in the table, emissions reduction commitments that countries and regions have made amount to a mere 1-1.5% reduction on an annual basis. But our CO2 monitoring and reporting system appears to be so idiosyncratic that it would be hard to defensibly attribute reductions in CO2 emissions to policy impacts.
The total discrepancy in CO2 emissions estimates is too large to be dismissed as statistical anomaly. For just twenty three countries, the total discrepancy adds up to nearly two billion tons, which is equivalent to saying that we are unsure about the existence of around a hundred large coal fired power plants on our planet [ii]. From a policy perspective, this scale of uncertainty is not tolerable.
The concerns about the reliability and the validity of CO2 emissions data described in this research is undoubtedly a serious problem for existing carbon reduction initiatives. Experts and the media unfortunately have either downplayed or under-reported such CO2 emissions data quality concerns, except when a prominent data issue crops up. For example, when the market discovered a discrepancy of around 100 million tons of CO2 between the EU’s verified emissions and the estimates that were applied for allocating emission permits (Ellerman and Buchner 2006), the price of each permit in the EU’s Emissions Trading Scheme carbon market took a significant tumble. The media covered that story thoroughly. But the media has failed to identify these types of data inconsistencies as a chronic concern for climate policy in general.
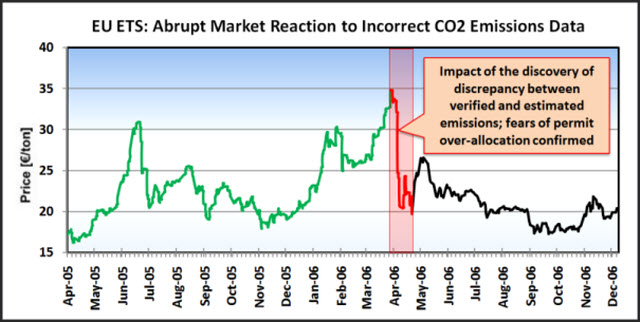
It is critical to understand that in the case of carbon markets, both under-estimates and over-estimates are problematic. Overestimation of CO2 may lead to a sudden price collapse, as seen in the EU case when participants had less need to trade to meet their emission quotas. Meanwhile, underestimates of CO2 could cause the price of carbon to be susceptible to significant price spikes due to an artificial scarcity. Therefore, for optimal performance of carbon markets, there is no alternative to getting CO2 emissions data as accurate as possible. In fact, one reason governments should push for carbon markets is because such markets quickly establish the incentives needed to get CO2 emissions data reporting right. In the absence of proper market mechanisms at the national level, monitoring each country’s commitment to reduce its CO2 emissions is likely to remain a dodgy issue.
Recommendations
In the process of examining limitations in existing data monitoring systems, www.CO2Scorecard.org has begun formulating recommendations for improvement. In addition to affecting methodological and definitional changes, national systems for collecting, compiling, and reporting the raw data on energy use and CO2 emissions need a serious overhaul to make them responsive to the urgent policy needs of climate management. Full transparency and a system of third party audits are essential elements for proper data quality control and timeliness of reporting. To the best possible extent, large stationary sources of CO2 emissions should work to install continuous emissions monitoring. Other sources should keep a detailed inventory of fuel use by type and quality, as well as quantity.
Further discussions on CO2 data quality issues are needed and we urge the leading journalists, bloggers, and opinion leaders to become more familiar with CO2 emissions and energy use numbers and their implications.
The CO2 Scorecard Group is committed to enhancing public understanding of this issue by displaying aggregated data on CO2 emissions and energy use from different sources on our website, www.CO2Scorecard.org, enabling users to observe and understand the underlying data better. CO2 Scorecard will also produce follow-up research notes on the issue of the accuracy and reliability of CO2 emissions reporting, which will also be available on the CO2Scorecard.org website.
We encourage and welcome debate and inquiries about this research and its implications, and hope that through this effort we can begin to build a better monitoring and verification system for global emissions of all types of environmental pollutants. There are many other types of environmental pollutants that cause direct harm to human and ecological health beyond the implications of carbon dioxide and global climate change. The more effectively we are able to measure emissions of all types, the more likely we are to understand the true outline of the problem at hand, and effectively monitor progress toward feasible and effective solutions.
References
BP (2010). Statistical Review of World Energy
Ellerman, A.D., and Buchner, B. (2006), “Over-Allocation or Abatement? A Preliminary Analysis of the EU Emissions Trading Scheme Based on the 2006 Emissions Data”. Report No. 141, MIT
Gregg, J.S., R.J. Andres and G. Marland (2008), “China: Emissions pattern of the world leader in CO2 emissions from fossil fuel consumption and cement production.” Geophysical Research Letters, 35, L08806, doi:10.1029/2007GL032887
McKibbin, J.W., Morris, A.C., and Wilcoxen, P.J. (2010), “Comparing Climate Commitments: A Model-Based Analysis Of the Copenhagen Accord”. The Brookings Institution.
Macknick, J. (2009). Energy and Carbon Dioxide Emission Data Uncertainties. IIASA Interim Report. IR-09-32.
Olivier, J.G.J. and Peters, J.A.H.W. (2009). “No growth in total global CO2 emissions in 2009”. Netherlands Environmental Assessment Agency.
Endnotes
[i] Gregg Marland, US Carbon Dioxide Information Analysis Center, Oak Ridge National Lab – Reuters “China seen topping US carbon emissions in 2007” Mar 23, 2007 - http://www.reuters.com/article/idUSL2272661220070323
[ii] A large (2GW) coal-fired power plant has a carbon footprint of approximately 20 million tons of CO2 per year, depending on efficiency, capacity utilization, and the carbon density of the coal being used (US EPA, EGRID 2000 – approx 1.124 tons CO2/MWh of coal generation, on average). For example, the 2.75 GW James H Miller Jr coal-fired plant in Alabama produced around 22 million tons of CO2 in 2009 (Clean Air Market Data, USEPA).
Data Notes
PBL-Netherland’s estimates of CO2 emissions for the year 2009 include CO2 emissions from gas flaring and industrial processes including cement, ammonia, and crude steel production. In comparison, BP’s estimates of CO2 are based only on the consumption of oil, gas and coal. In spite of the fact that PBL’s estimates include more sources of CO2 emissions compared to BP, we observe that BP’s estimates tend to be higher.
Nevertheless, to the best extent feasible, we try to harmonize the two datasets in terms of the underlying sources of energy use that account for the total CO2 emissions of countries. Typically gas flaring and industrial processes contribute only a small fraction of the total CO2, except in the case of large emitters like China and India where cement production accounts for 6-8% of the total CO2. We therefore, try to deduct the share of CO2 from the cement sector from PBL’s totals. Fortunately the EDGAR 4.1 database provides the estimates of CO2 emissions from cement production—the non-energy component associated with the calcination process. We subtracted these cement sector estimates to adjust PBL’s CO2 emission estimates to harmonize further with BP’s data.
It was not possible to adjust for gas flaring and other non-energy sources of CO2 emissions. However, as the research note highlights, data discrepancies between BP and PBL are so large that it is unlikely to be superseded by the margin of error arising from adjustments for marginal sources like gas flaring or industrial processes including ammonia and crude steel.
Quantification of CO2 Discrepancy: As explained in the note, both over-estimation and under-estimation of CO2 emissions have negative consequences for climate management policies. Therefore, we quantify CO2 discrepancy as the sum of the absolute values of over-estimates and under-estimates. This method ensures that over-estimates and under-estimates of CO2 emissions do not cancel each other in the aggregate to create a misleading assessment of the underlying margin-of-error between two sources of CO2 emissions data.
EDGAR/PBL refers to the spliced dataset including EDGAR 4.1 times series for CO2 emissions from energy use for the period 1970-2005, and PBL-Netherlands estimates for the period 2006-09. (PBL is The Netherlands Environmental Assessment Agency)
For comments or clarifications contact Shakeb(dot)Afsah(at)CO2Scorecard.org or Michael(dot)Aller(at)CO2Scorecard.org