Mild winter biggest factor in 20-year low for US CO2 emissions
Written by:
*Shakeb Afsah,
*Kendyl Salcito and
**Jonathan Koomey • Sep 06, 2012
Topic: CO2 emissions
*The CO2 Scorecard Group, **Research Fellow, Steyer-Taylor Center for Energy Policy and Finance, Stanford University
Hitting a major benchmark, US CO2 emissions for the first three months of 2012 dropped to its lowest quarterly level in 20 years. Within the scope of a recent emissions reduction trend, this event deserves all the press coverage it is receiving.
An US Energy Information Administration (EIA) brief marking the event cited a mild winter, a reduction in gasoline demand and a decline in coal-fired electricity generation linked to low natural gas prices.
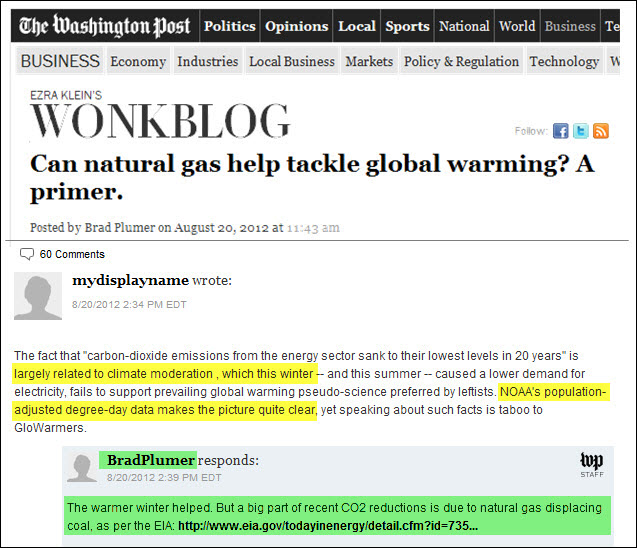
But the press reporting has been markedly disparate from the EIA analysis. Reporters have focused uniquely on the role of natural gas displacing coal while making little or no mention of other factors.
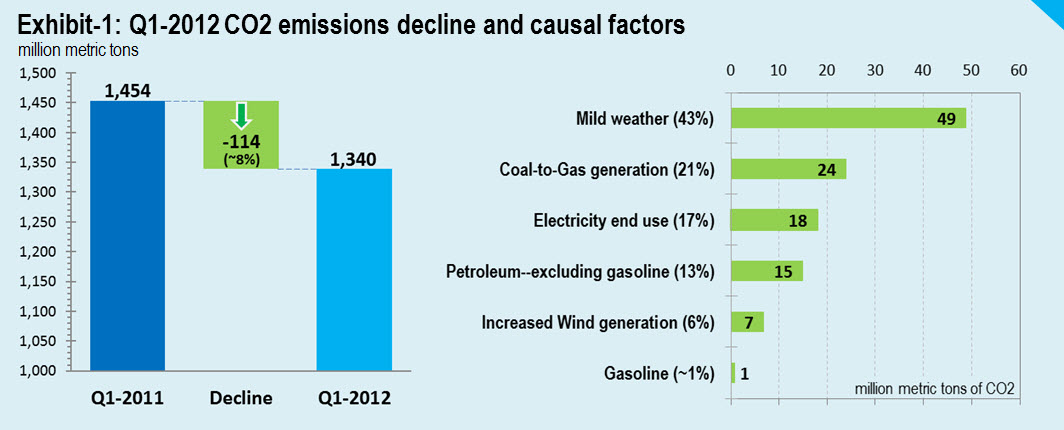
We are cognizant of the contributions of natural gas to emissions reduction. We regularly quantify these contributions, and we have done so once again to bring perspective to the discussion of 2012 emissions reductions. Our calculations show that increased use of natural gas in lieu of coal accounts for about 21% of this quarter's emissions reductions. As shown in Exhibit-1, five additional factors explain the remainder of the CO2 reductions. The full analysis and the data for reproducingour results are further discussed in this note and the appendices.
Quantifying Gas-for-Coal Replacement
If cheap gas is substituting for coal, then declining coal-powered electricity should align well with rising gas-powered electricity. The EIA's Monthly Energy Review (MER) reports this data directly. Between the first quarters of 2011 and 2012, coal generation fell by 95 million MWh, hydro generation by 11.5 million, nuclear by 5.2 million and petroleum by 2.4 million. This 115 million MWh reduction in electricity generation was partially compensated by a 69 million MWh increase in natural gas generation and 9 million MWh increase in wind-powered generation.
These figures demonstrate two important points. First, some coal reductions are occurring independently of gas generation, since natural gas is not filling in for all the lost coal generation. Second, the overall reduction in electricity generation correlates with long-term declines in electricity demand – natural gas plays no role in this phenomenon.
But natural gas is not irrelevant to emissions reductions. Our calculations of the emissions reductions resulting from the transition of coal-to-gas power generation is detailed in Appendix 1 and amounts to approximately 57 million MWh. With natural gas saving about a half a metric ton of CO2 per unit of for every MWh of coal replacement, that equals about 28 million tons of CO2. But by replacing some of hydro and nuclear, natural gas actually added 5 million tons of CO2, resulting in a net reduction of about 24 million metric tons of CO2.
The US slashed 114 million metric tons of CO2 in the first quarter of 2012 – the 24 million tons saved by natural gas power generation represents about 21% of that. Natural gas is playing a relevant but supporting role in America's emissions improvements.
CO2 cuts from petroleum
The EIA suggests that gasoline has been another major contributor. We assume that by gasoline, the EIA is referring to motor and aviation gasoline in the transportation sector. The EIA reports that gasoline emissions remained virtually unchanged during the period at 270 and 269 million metric tons of CO2 in the first quarters of 2011 and 2012 respectively (MER June 2012, Table 12.1). Declining gasoline use has been irrelevant to first quarter CO2 reductions.
For all petroleum products however, EIA reports a 16-million-ton decline in CO2 emissions (Q1-2012 total of 559 million versus Q1-2011 total of 575; MER June 2012, Table 12.1). After deducting a million ton from gasoline, it leaves 15 million metric tons of CO2 or roughly 13% of the total reduction in first quarter emissions between 2011 and 2012—most came from reduced use of distillate and residual fuel oil in industrial and transportation sectors. Reduced petroleum in electricity generation contributed a reduction of just two million metric tons.
Mild winter effect
The EIA's indication that the mild winter of 2012 reduced emissions is backed by more compelling data. The heating degree days (HDD) in the first quarter of 2012 was lower by 21% compared to the "normal" and 23% over 2011 (EIA, MER February, March and April 2012, Table 1.9).
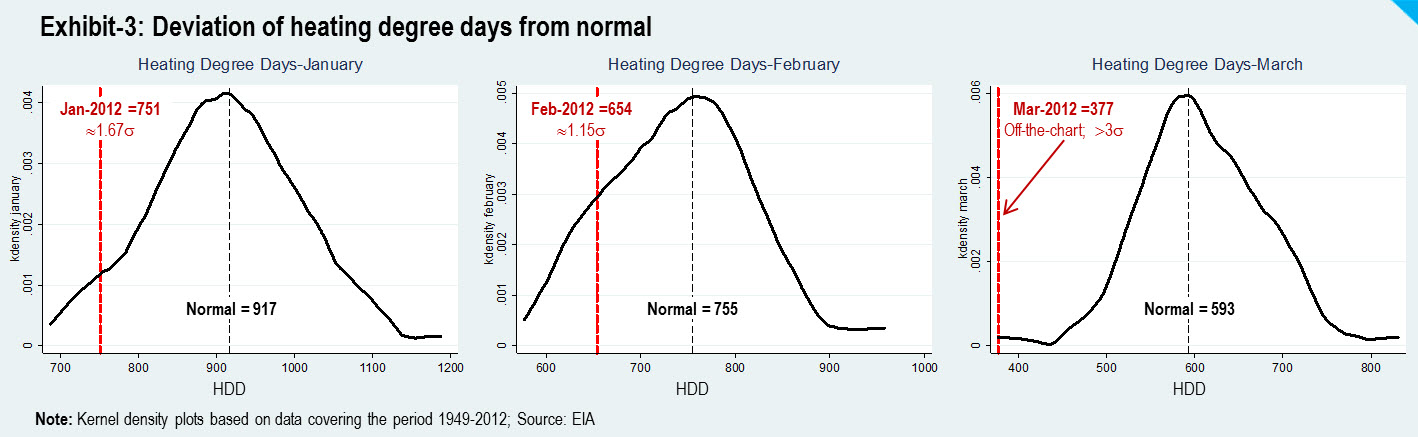
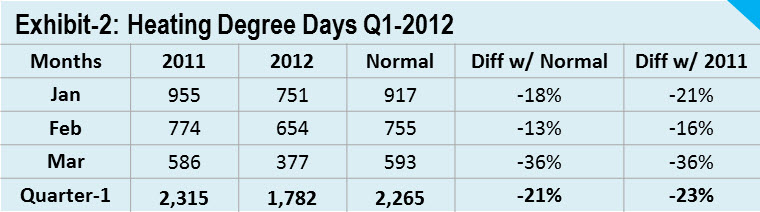 A closer look at the HDD data from 1949-2012, makes it even clearer that the first three months of 2012 were significantly warmer than the normal. Most strikingly, the month of March emerged as extremely warm as it is less than the normal HDD by more than three standard deviations (Exhibit-3). EIA has already highlighted the significance of this mild winter in one of its postings.
In quantitative terms, the EIA estimates that a 10% increase/decrease in HDD leads to 10% increase/decrease in energy use for space heating (see EIA’s section “Adjusting for Weather and Climate”). Additionally, both natural gas and electricity are used for space heating in residential and commercial sectors. Therefore, the mild winter of 2012 has cut CO2 emissions by cutting the demand for natural gas as well as electricity end use. For petroleum, distillate fuel oil is used for space heating specially in the Northeast and Alaska, but its use remained unchanged in the first quarter (EIA MER June 2012, Tables 12.2 & 12.3).
 Between January and March, more than 80% of natural gas in the residential sector is typically used for space heating (Appendix-2; row [2.1.5]); for the commercial sector this number is 68% (see Appendix-2; row [2.2.5]). The remainder is used for water heating, cooking and other uses—these end uses, unlike space heating which is seasonal, are expected to remain steady through the year. As a result the decline in the consumption of natural gas in residential and commercial sectors in the first quarter is attributable entirely to the change in the number of HDD compared to the previous year (see validation of this conclusion in Appendix-2; subsections [2.1.0] & [2.2.0]).
According to the EIA data, reduced natural gas needs in the first quarter of 2012 eliminated a total of 37 million metric tons of CO2 over the 2011 period—25 of those came from homes, and 12 million from the commercial sector (EIA, MER June 2012, Table 12.2 and 12.3).
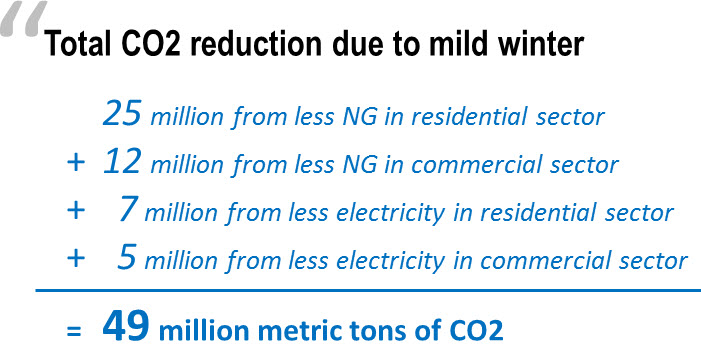 For electricity, space heating accounts for 5.8% of the total electricity consumption in the residential sector (EIA FAQ and Appendix-3, row [3.1.1]) and 9% for commercial buildings (see Appendix-3, rows [3.2.5]). Just like natural gas, electricity needed for space heating should decline in proportion with the change in HDD between Q1-2011 and Q1-2012. This according to our calculations eliminated a total of 12 million metric tons of CO2—7 million from residential sector and 5 million from commercial (see Appendix-3, rows [3.1.8] & [3.2.11]).
Therefore the combined total reduction in CO2 due to a rather mild winter in the first quarter of 2012 comes to around 50 million metric tons. In terms of share, the mild winter accounts for 43% of the 114 million metric ton reduction in CO2 emissions.
The missing causal factors
Electricity end use: This factor has already surfaced in calculations above. Total end-use demand for retail electricity declined by 39 million MWh (from 919 million in Q1-2011 to 879 million in Q2-2012; EIA MER June 2012, Table 7.6). We know that a reduction of around 16 million MWh is associated with lower electricity needs for space heating (Appendix-3; rows [3.1.6] & [3.2.9]). This leaves around 23 million MWh of generation that was eliminated due to a first quarter dip in the end use demand—most of which occurred in the residential sector. As shown in Appendix-4, this accounts for 18 million metric tons of savings in CO2 emissions.
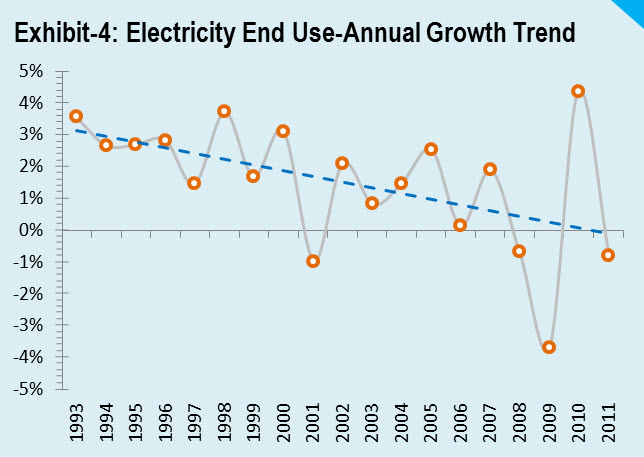 This factor will continue to play a role in the future because the growth rate in total end use electricity has been steadily falling since 1993 (Exhibit-4). If this trend continues, electricity end use demand is likely to stagnate or even enter a period of net negative growth—in that case it will cut CO2 emissions even further.
Contribution of wind power: Electricity generation from wind increased by ~9 million MWh from 29 million at the end of the first quarter in 2011 to 38 million 2012—an increase of 30%. Some wind power replaced the generation lost from nuclear and hydro, and the remainder filled in for coal. That according to the calculations cut ~7 million metric tons of CO2 (Appendix-1, Rows 4.3, 5.3, 7.2 and 9.1).
Summary
As stated by the EIA, the first quarter of 2012 cut 114 million metric tons of CO2 compared to the first quarter of 2011. The EIA brief cited three causal factors behind the record first quarter decline. These are mild winter, coal-to-gas fuel switching in the electricity sector and reduced gasoline demand.
We show that reduced gasoline demand played no role in cutting the first quarter emissions. Between the two remaining causes, mild winter slashed a total of 49 million metric tons, and gas-to-coal replacement for electricity generation contributed another 24 million. This still left 36% of CO2 cuts unexplained.
We fill this CO2 accounting-gap by quantifying the contributions of three more factors. These include: (1) reduced demand for petroleum products other than gasoline that cut 15 million metric tons, (2) a dip in electricity end use (excluding space heating) cut another 18 million, and (3) increased generation from wind eliminated 7 million metric tons of CO2. These six factors together account for the record reduction of 114 million metric tons of CO2 observed in the first quarter of 2012.
In nearly four decades, 2008-09 is the only other period when the annual change in the first quarter total for CO2 emissions decreased by more than 100 million metric tons (Exhibit-5). The reason then was the economic recession of the US. One tentative lesson seems to emerge here—that is whenever a quarterly drop in CO2 emissions exceeds 100 million tons, there is a good chance an external factor is in play. That’s sobering because it indicates that neither market nor half-hearted policies have the muscle-power to pull CO2 emissions down to a record low as observed in the first quarter of 2012.
Policy Message
The flurry of media reporting that followed the release of EIA’s data on CO2 emissions focused exclusively on the role of natural gas in the electricity sector. The policy danger of such a natural gas-centric storyline is obvious—if the public and politicians believe that cheap natural gas is doing a really good job of cutting CO2 emissions, it will undercut the urgency to continue with production tax credits for renewables and will also delay the adoption of policy instruments based on carbon prices. In addition, the weather-related reductions in space heating emissions are all but certain to be offset by increases in emissions caused by increased need for summer cooling in a warm year. One should not assume from the first quarter data that the emission reductions attributable to warm weather will contribute to continued emission reductions on an annual basis.
References
Begos, K. 2012, “CO2 Emissions in US Drop to 20-Year Low”, Associated Press, 16 Aug 2012
Marshall, M. 2012, “Lowest US carbon emissions won't slow climate change”, New Scientist, 20 Aug, 2012
Nuwer, R. 2012, “A 20-Year Low in US Carbon Emissions”, The New York Times, Aug 17, 2012
Plumer, B. 2012, “Can natural gas help tackle global warming? A primer.” The Washington Post, 20 Aug, 2012
Appendix
Download explanatory notes, data sources and analysis
Supplemental Exhibit-1