Shale Gas and the Fairy Tale of its CO2 Reductions
Written by:
Shakeb Afsah and
Kendyl Salcito • Aug 07, 2012
Topic: natural gas
Summary
Recent declines in CO2 emissions in the US have made shale gas a fossil fuel of much adulation, but this reputation is unfounded. We show that price driven displacement of coal by natural gas can account for just around 10% of the CO2 reductions during the period 2006-11. Nearly 90% of the cuts in CO2 emissions were caused by: (1) the decline in petroleum use in the transportation sector, (2) displacement of coal by mostly non-price factors, and (3) its replacement by wind, hydro and other renewables.
Each ton of CO2 saved from price driven displacement of coal by gas in the electricity sector was offset by a ton or more of CO2 from its increased use in commercial, residential and industrial sectors.
We also show that both renewables and energy efficiency measures independently outperform the CO2 savings from coal-to-gas displacement, indicating that natural gas can at best play a peripheral role in cutting CO2 emissions, and it cannot substitute for authentic climate policies based on regulations, clean energy standards and carbon price.
Natural gas deserves credit where it is due, but pro-gas advocacy has led to a significant overstatement of the true CO2 cutting credentials of shale gas. This is a mistake and it undercuts the effort to keep policy discussions accurate.
Many are adrenalized by shale gas, but let’s not lose track of what it can or cannot do for climate change. Natural gas is at its best when it displaces coal, but it is at its worst when it suppresses renewables and energy conservation. Striking the right balance will need a mix of policies including clean energy standards, energy efficiency programs, regulations and a carbon tax; unfettered shale gas supply is not the answer.
Corresponding author: Kendyl.Salcito@CO2Scorecard.org
We are thankful to Danny Cullenward, Jon Koomey, Skip Laitner, Thomas Sterner, Gernot Wagner and David Wheeler for their comments on this research note. All the views and opinions expressed in this note should be attributed only to the authors and the CO2 Scorecard Group. This research note is supported solely by the efforts and resources of The CO2Scorecard Group and the parent consulting firm Performeks LLC based in Bethesda MD, US.
Full Report
Between 2006 and 2011 the US cut its CO2 emissions by nearly half a billion metric tons—more than any other country in the world. This remarkable decline overlaps with the boom in shale gas production, triggered by the large-scale commercialization of fracking technology. The production of natural gas has since soared, and the price has tumbled. Suddenly natural gas has emerged as a more attractive fuel for electricity generation than coal.
This is a new trend. For decades coal was the favored fuel for electricity generation. Particularly after the 1973 Arab oil embargo, the US government limited natural gas use in industries and power plants out of fear that we would exhaust our domestic reserves and be unprepared for the next crisis. This restriction on natural gas led to a steep rise in electricity generation from coal.
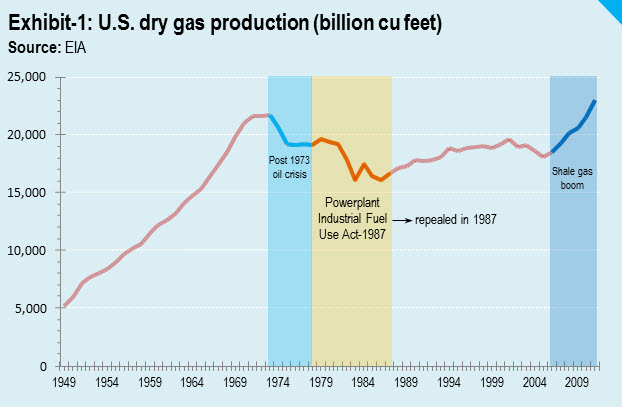 As oil crisis fears subsided, the market for natural gas revived, beginning when the Powerplant and Industrial Fuel Use Act of 1978 was repealed in 1987. For the next two decades, domestic production of natural gas made limited gains in the energy market, but in 2006, the year shale gas began to flood the market (Exhibit-1), it set the stage for the price of natural gas to hit the floor. This boom in shale gas correlates with a national drop in CO2 emissions.
Industry enthusiasts, researchers (Lu et al. 2012) and bloggers (Worstall 2012) have credited natural gas for this recent decline in CO2 emissions, citing economics as the impetus—the rising price of coal and the falling price of natural gas make it profitable for electricity producers to switch from coal to gas. This price driven shift to natural gas has been hailed as a great step forward in the fight against climate change.
Because natural gas generates just over half the CO2 emissions of coal per unit electricity, it is considered cleaner. CFR Senior Fellow for Energy and the Environment Michael Levi made the point in this quarter's edition of Foreign Policy. Natural gas's lower carbon intensity and rising use has been lauded by the International Energy Agency (IEA) and in serious outlets like The Economist and the Financial Times as the reason US CO2 emissions declined in the five years between 2006 and 2011. In that period, total CO2 emissions from fossil fuel fell by 446 million from 5,919 to 5,473 million metric tons (EIA 2012A)—a total of 7.54% decline amounting to an average annual rate of 1.56%.
King coal under siege
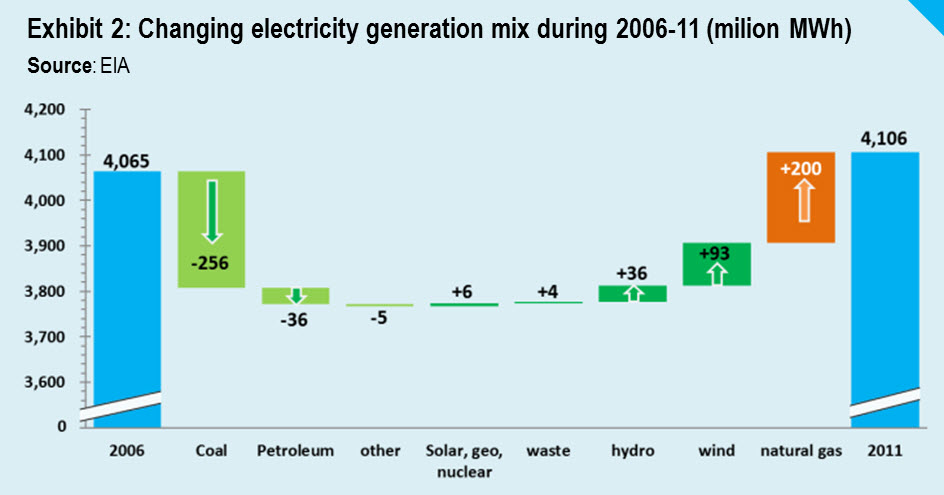
Between 2006 and 2011, America's electricity generation mix changed dramatically. Though the US increased its electrical output by 41 million MWh, electricity generated from coal and petroleum dropped by a total of 292 million MWh (256 million shed from coal and 36 million from oil—EIA 2012A). Meanwhile, natural gas generation increased by 200 million MWh – a major gain but not enough to cover the loss from coal and petroleum, let alone the additional 41 million MWh generated over the period (Exhibit-2).
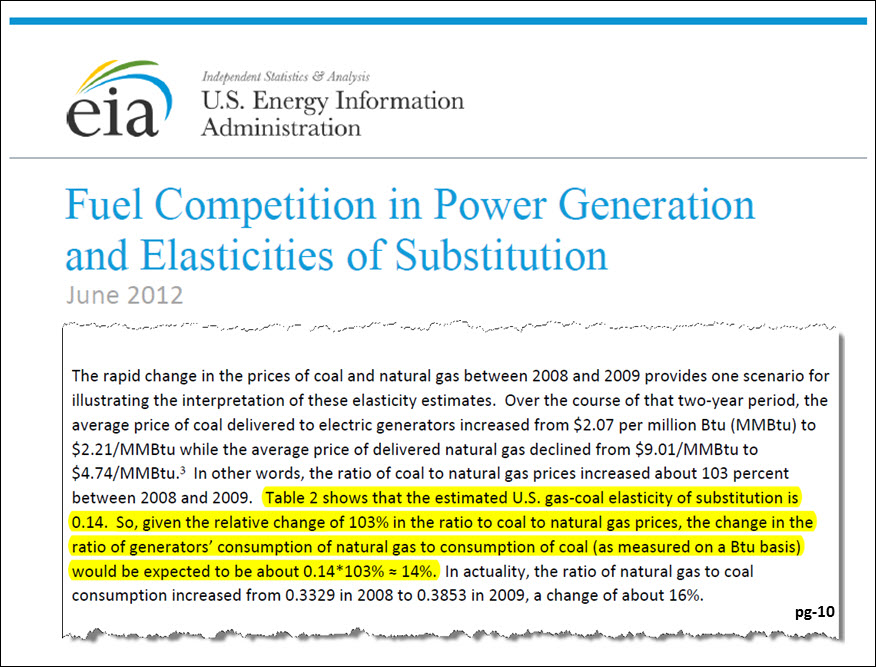
 Natural gas doesn't account for all of the reductions in coal- and petroleum-fueled electricity, but we take industry experts at their word that low shale gas prices helped fuel the shift. To quantify the price effect, we need an empirical estimate of the short-run elasticity of fuel substitution, which is provided by a recent EIA analysis (EIA 2012B). The analysis estimates that a 1% increase in the ratio of the delivered fuel price of coal to the delivered price of natural gas to power plants leads to an average 0.14% increase in the fuel input ratio of natural gas to coal. Short-run elasticity is appropriate for the analysis because most of the switch from coal to gas is expected to utilize the existing capacity of gas-fired units (Kaplan 2010; see data notes 1 & 2).
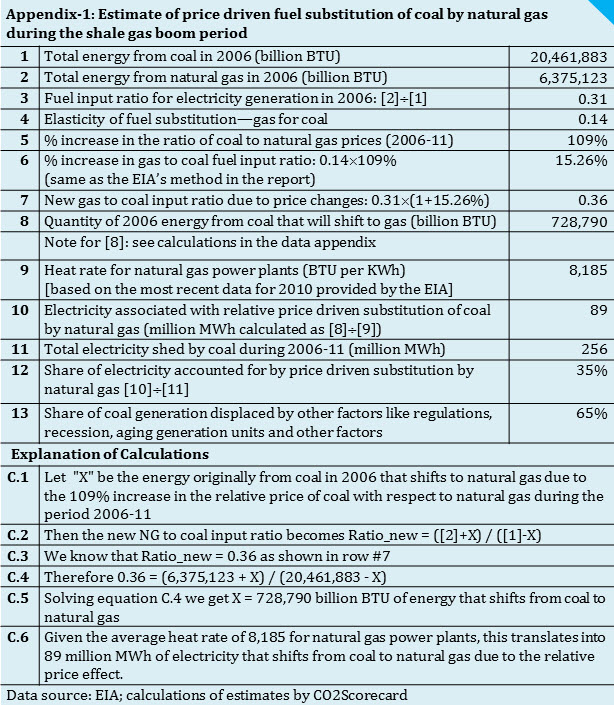
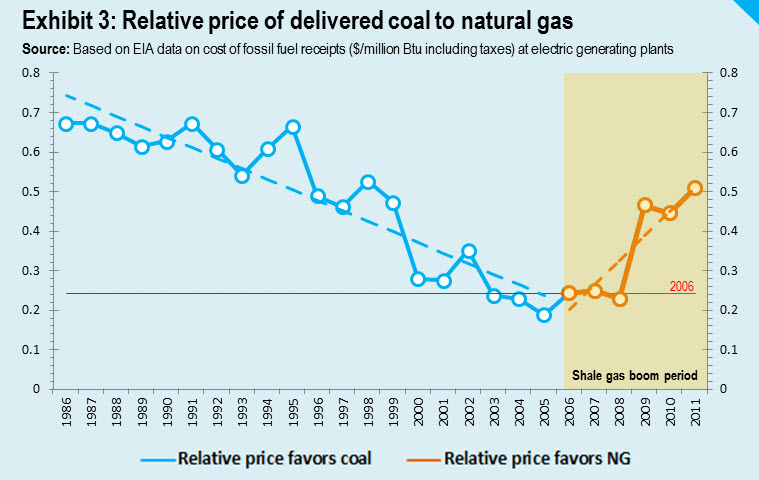 During the shale gas boom, the price of coal increased 109% relative to the price of natural gas (Exhibit-3). This relative price effect would increase the ratio of gas to coal use by around 15% if the EIA's methodology and elasticities are used (supplemental Exhibit-S1). That 15% translates to an increase in the predicted fuel input ratio of gas to coal from 0.31 to 0.36 over those five years. This is equivalent to a shift of around 728,790 billion BTU of input energy from coal to natural gas (Appendix-1 and data note #3). Natural gas power plants need on average 8,185 BTU to generate one KWh of electricity (EIA 2011). Therefore, 728,790 billion BTU will translate into an average displacement of around 89 million MWh of electricity from coal to natural gas. This quantity, it turns out, accounts for just around 35% of the total electricity generation shed by coal. If the replacement is entirely through natural gas combined cycle units this number will increase to 37% (data note #4).
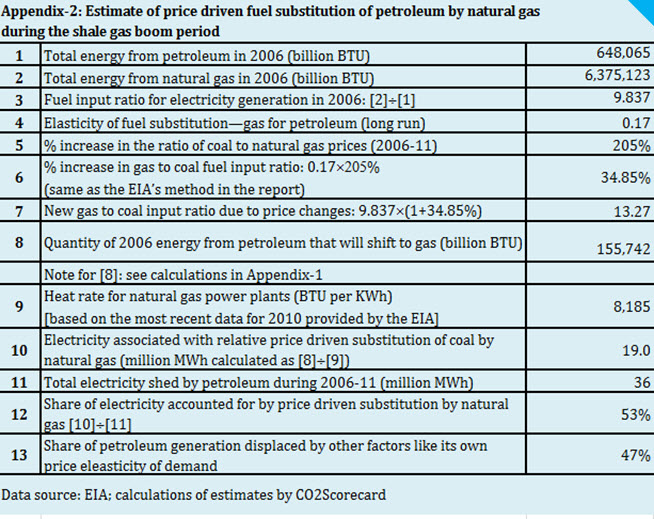
Petroleum-to-coal displacement: As expected, the EIA study found that petroleum to natural gas switching is equally responsive to the relative price changes. The EIA report states that fuel switching between petroleum and gas is quite common and well established, specifically in the peak and intermediate load ranges—hence factors of production are already well adjusted. It is therefore appropriate to use long-run cross price elasticity of substitution, which gives an estimate of 19 million MWh of electricity from petroleum that shifted to natural gas (Appendix-2). EIA data shows that petroleum based generation fell by 36 million MWh—indicating that more than half of oil was replaced by natural gas. This is not surprising, because the relative price of petroleum to natural gas increased by more than 200% during the period 2006 to 2011.
Further accounting of displaced coal
If only 89 million MWh (35%) from coal was displaced by natural gas due to the relative price advantage, how do we account for the remaining 167 million MWh that coal lost during the period of the shale gas boom?
Stephen Lacey of Climate Progress (Lacey 2012) and David Roberts of Grist (Roberts 2012A) have put forth seven factors that are together shutting down coal generation—two are the respective prices of coal and gas, as calculated above. The remaining 167 million MWh (65%) that coal lost during the period of the shale gas boom was due to Roberts' and Lacey's other five factors— (1) regulations, (2) energy efficiency/demand management, (3) improving cost-competitiveness of renewables, (4) recession and (5) NGO campaigns.
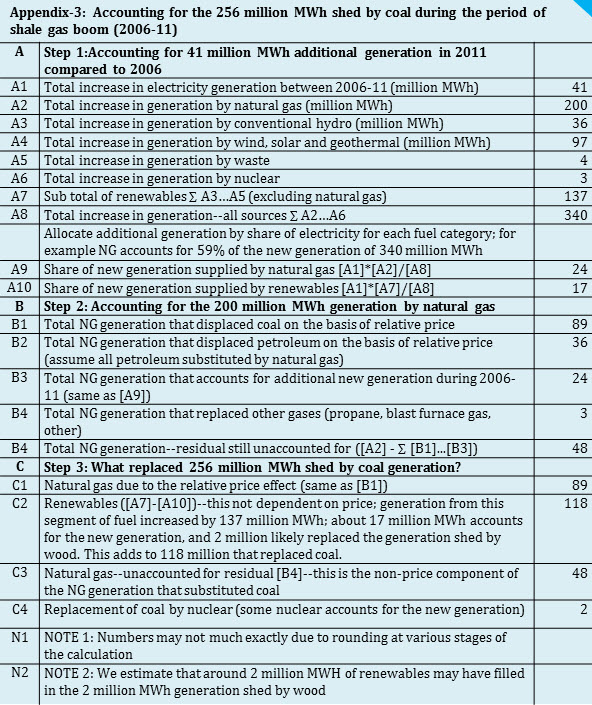
Where the low price of natural gas failed to fill the void left by coal, the other five factors show their significance. Renewables filled in about 120 million MWh of the coal generation gap—with wind accounting for around 82 million (Appendix-3). These non-carbon sources typically don’t have much price advantage over coal, yet they account for 46% of its replacement. This gives some indication of the impacts of clean energy programs like production and investment tax credit (PTC & ITC), state level Renewable Portfolio Standards (RPS) and the increasing cost competiveness of wind. Nuclear supplied around 2 million MWh.
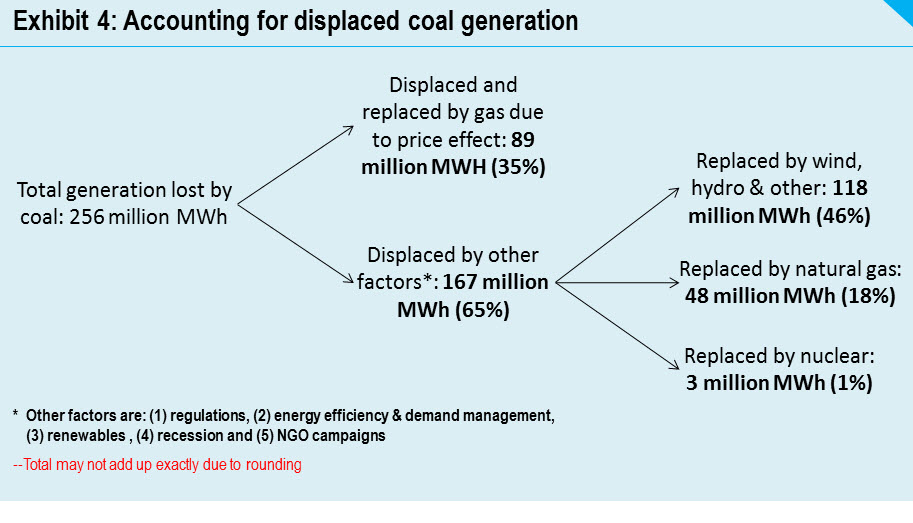
Gas stepped in to fill up the remaining 48 million MWh (~19%) of power shed by coal—but it's not appropriate to say it "displaced" coal; rather it “replaced” coal which was “displaced” by other non-price factors (Exhibit-4). That 48 million MWh of electricity was not going to be generated by coal, regardless of the price differential with gas. If gas were not excessively cheap, it is quite likely that some of this 48 million MWh would have come from renewables.
The tangled web of coal displacement
Our analysis leads us to conclude that irrespective of the low price of natural gas and the underlying elasticity of fuel substitution, electricity generation from coal would have declined significantly between 2006 and 2011. Primary evidence of this comes from two observations. First nearly 117 million MWh of electricity from wind, hydro and other renewables replaced 46% of the generation void left by coal—these sources could not compete with coal or natural gas on the basis of generation cost during the period.
And second, the biggest drop in coal generation (230 million MWh) occurred during 2008-09—the year when recession peaked in the US. During the same period, relative price of coal to gas increased by 103%; yet natural gas added a meager 38 million MWh—16.5% of the total electricity shed by coal. Clearly natural gas wasn’t displacing coal due to its low price. Instead, the demand for electricity tanked due to recession.
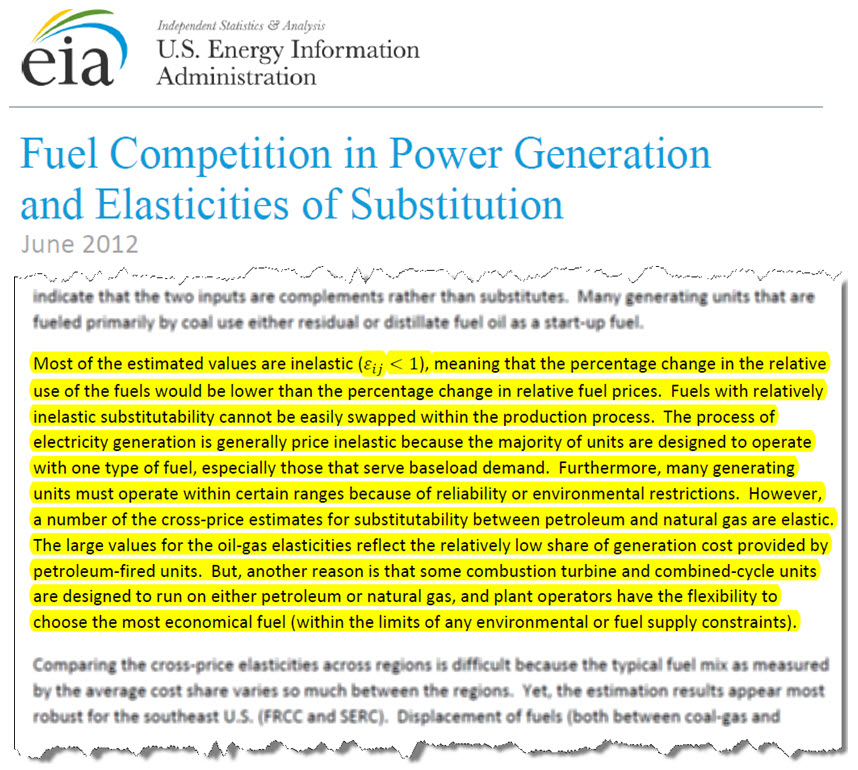
So why didn’t natural gas replace all of the 256 million MWh of electricity shed by coal? The insight on this comes from the EIA’s estimate of the overall average elasticity of coal to gas fuel substitution in the US during the period 2005-10—this value is just 0.14 (rather inelastic). In other words the move from coal (mostly baseload) to gas is not as seamless as the move between petroleum and gas, which are often peak and intermediate load units and sometimes involve dual-fuel technology where fuel switching is comparatively easier (read EIA’s explanation in supplemental Exhibit-S1).
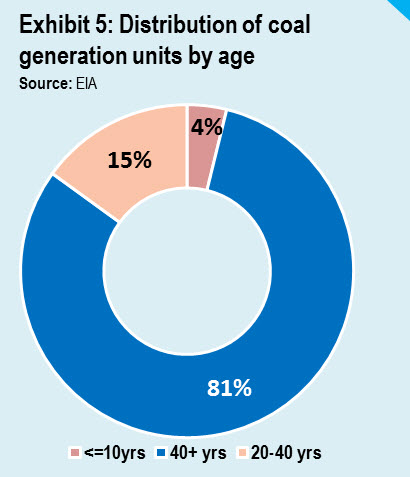 In the future we expect the price of natural gas to increase (Fordney 2012 and Finger 2012) but we will continue to see a decline in coal generation. A big part of that trend will reflect the impact of USEPA’s regulation and the aging stock of coal-fired generation units, as more than 80% of coal units are forty years or older (Exhibit 5), and many will simply fade away. Industry experts have already written off coal (Tierney 2012), and recently Michael Liebreich of Bloomberg New Energy Finance called it a “…sunset for traditional, old-style, inefficient coal plants” (Roberts 2012B). Just last week, their predictions got affirmed by the EIA (EIA 2012C). In some sense the demise of coal may be on auto-pilot now.
The CO2 story
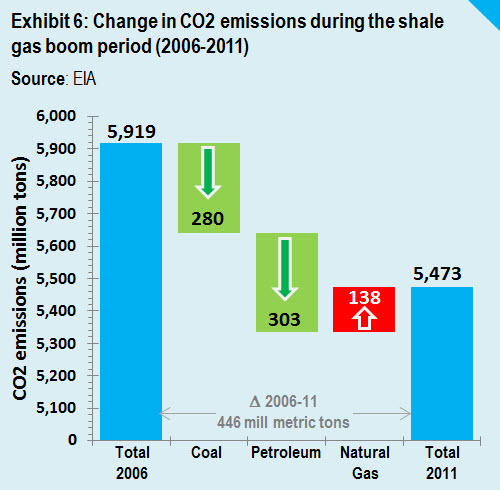 Natural gas is an even smaller factor in reducing CO2 emissions than it is in displacing coal. In fact, natural gas is the only fossil fuel that added emissions to the US inventory between 2006 and 2011 – a total of 138 million metric tons during the period (Exhibit-6).
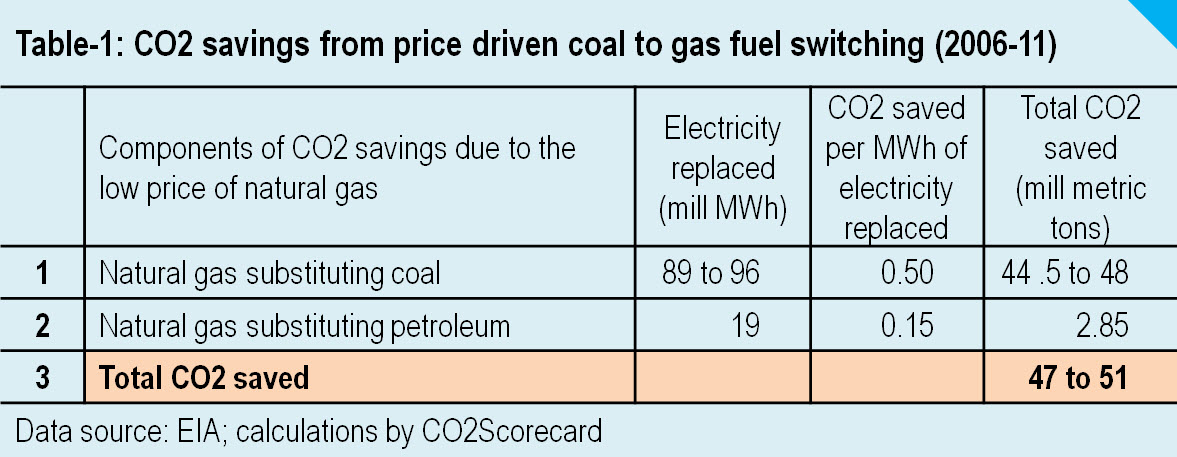
This figure is important because many have justified the low price of natural gas as good for our climate because it saves CO2 by displacing coal. But the portion of those emissions that displaced coal and oil emissions was limited. Table-1 shows the emissions savings involved in the price driven switching from coal andoil to gas. For coal the savings is a half-ton of CO2 per MWh displaced. For oil, it is around 0.15 tons. As shown in Table-1, natural gas displaced around 89-96 million MWh of coal electricity and 19 for petroleum. The two together generate a savings of »50 million metric tons of CO2—that seems significant at first glance, but total CO2 emissions declined by 446 Million metric tons between 2006 and 2011. The 50 million metric ton savings from natural gas accounts for just 11% of that. In other words, nearly 90% of the decline in the total CO2 emissions during the period 2006-11 should be attributed to other factors that slashed the consumption of both petroleum and coal.
 Even where natural gas is displacing coal, this substitution is not having a meaningful impact on CO2 emissions. Set on a national scale, the difference is negligible. Emissions dropped at a rate a 1.56% per year inthe 5 years up to 2011, dropping from 5,919 to 5,473 million metric tons. If the 50 million metric tons of CO2 savings from natural gas were excluded from this calculation, emissions would have dropped 1.38%. That 0.18% change is within any reasonable margin of error. Shale gas has indeed contributed to CO2 reduction, but trivially compared to other factors.
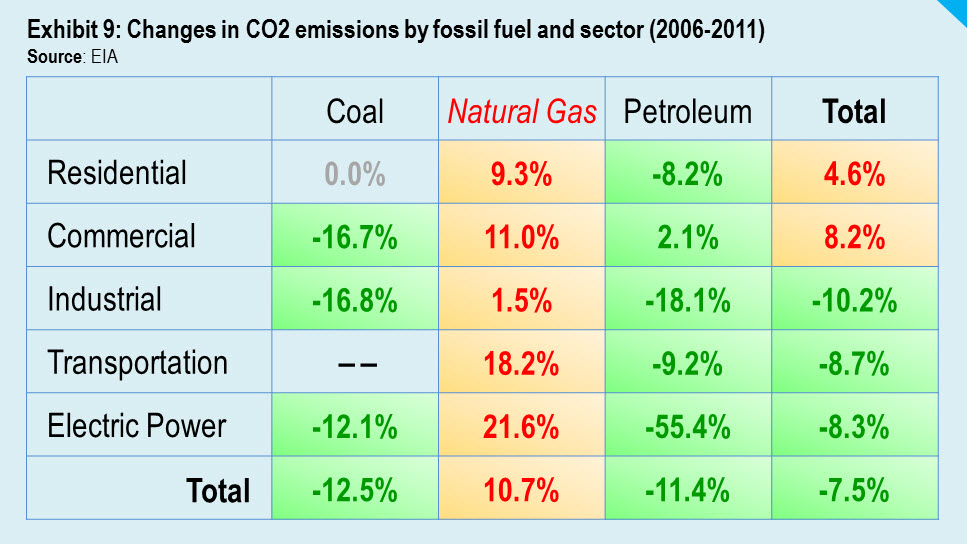
The CO2 offset story
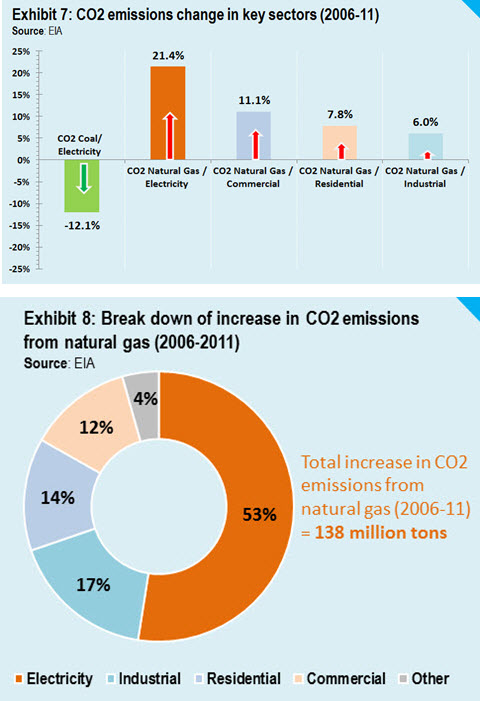 Natural gas remains a net contributor of CO2, regardless of its comparatively low carbon intensity. This is due to the multiplicity of its uses. Unlike coal, which is primarily used for electricity generation, natural gas is used for generating electricity as well as directly in commercial, residential and industrial sectors. Therefore, when the price falls as it did during the shale gas boom, consumption of natural gas gets a boost across all sectors—not just electricity generation. Sixty-six million metric tons, or 47%, of the increase in CO2 from natural gas occurred in commercial, residential and industrial sectors (Exhibits 7, 8 & 9) where natural gas isn’t necessarily displacing a dirtier fuel like coal. The 50 million tons it saved from substituting coal generation by virtue of its low price came at the cost of generating 66 million additional tons of CO2 from other sectors.
Once we add in methane leakages to its CO2 emissions, natural gas could surpass coal in terms of its overall impact on our climate (Wigley 2011 and
The New York Times 2011). And, just like coal, natural gas from shale rock also has a variety of local environmental impacts. When you combine these impacts —global and local, natural gas looks more and more like coal.
Policy message
Our analysis highlights how little the low price of shale gas has achieved in abating carbon pollution from fossil fuels. It also exposes the weaknesses in arguments of those who are keen to brand shale gas as a solution for climate change.
Natural gas deserves credit where it is due. But our findings show that there’s been a significant over-statement regarding shale gas’s contribution to cutting CO2 emissions in the recent years. This is surprising because readily available data point to the contrary.
Natural gas cannot be credited with the reductions in the US CO2 emissions observed in the last half-decade. Most reductions, nearly 90%, were caused by the decline in petroleum use, displacement of coal by mostly non-price factors, and its replacement by wind, hydro and other renewables. Where low price of natural gas saved some CO2 by displacing coal, it was quickly offset by its increased use in other sectors—highlighting the pitfall of justifying the current market for natural gas as a “bridge” or an interim phase of transition towards clean energy.
In comparison, each MWh replacement of coal by renewables eliminated a ton of CO2, adding to more than a 100 million metric tons of CO2 savings. Energy efficiency/conservation efforts as estimated by the falling economy-wide energy intensity also saved significant amount of CO2 between 2006 and 2011 (see Appendix-4). Clearly, these measures independently outperform the CO2 savings from the low-price driven coal-to-gas displacement, showing that authentic climate policies based on regulations and clean energy standards are essential for lasting cuts in CO2 emissions.
Carbon price still remains a missing piece in the US, but the timing cannot be better for putting it back on the table.
Coal appears to be on its way out, so we are likely to see some reductions in CO2 emissions. But the US needs far bigger cuts than what it can achieve from the autonomous rate of decline in coal generation—after all, CO2 per capita in the US is fifty percent higher than the average for OECD countries.
This is not the time to be passive on the policy front. The ongoing transition in the electricity sector opens up at least two opportunities for lawmakers—first we can strengthen our energy efficiency and conservation programs to permanently eliminate some of the electricity shed by coal, and second we can try to maximize the replacement of coal by renewables.
We know that natural gas can displace some coal through its price effect. To date, over-production of shale gas has given it this relative price edge. But natural gas can also get the same or better price edge over coal through a carbon tax. This tax will ensure that natural gas is economically superior to coal without giving it an upper hand on renewables.
References
EIA (2011), “Average Operating Heat Rate”, Nov 9, 2011
EIA (2012A), “Monthly Energy Review”, Jun 2012
EIA (2012B), “Fuel Competition in Power Generation and Elasticities of Substitution”, Jun 2012
EIA (2012C), “27 gigawatts of coal-fired capacity to retire over next five years”, Today in Energy, Jul 27, 2012
Finger, R. (2012), “More Data: Natural Gas Is Heading Higher”, Forbes, Jul 27, 2012
Fordney, J. (2012), “Renewable costs to continue slide, natural gas to rise: US FERC's Norris”, Platts News and Analysis, Jul 23, 2012
IEA (2012), “Global carbon-dioxide emissions increase by 1.0 Gt in 2011 to record high”, May 24, 2012
Kaplan, S. M. (2010), “Displacing coal with generation from existing natural gas‐fired power plants,” Congressional Research Service Report for Congress R41027, Jan. 19, 2010
Lacey, S. (2012), “Coal on the Ropes: In One Week, 4,099 MW of U.S. Coal Plants Are Set to Close or Hung Up in Court”, Climate Progress, Feb 1, 2012
Levi, M. (2012), “Think Again: The American Energy Boom”, Foreign Affairs, Jul/Aug 2012
Roberts, D. (2012A), “U.S. leads the world in cutting CO2 emissions — so why aren’t we talking about it?”, Grist, Jul 17, 2012
Roberts, D. (2012B), “Coal and China: Bad, but maybe not as bad as you think”, Grist, Jul 3, 2012
Tierney, S. F. (2012), “Why Coal Plants Retire: Power Market Fundamentals as of 2012,” Analysis Group Inc., Feb 24, 2012
The Economist (2012), “Some fracking good news”, May 25, 2012
Wigley, Tom M.L. (2011), “Coal to gas: the influence of methane leakage”, Climatic Change, Vol 108, No. 3. Oct 2011
Witkin, J. (2011), “Replacing Coal With Gas Is No Panacea, Study Says”, The New York Times, Sep 14, 2011
Worstall, T. (2012), “Why Shale Gas is Closing Coal Plants: So Why Do the Hippies Hate Shale?”, Forbes, May 5, 2012
Data Notes:
1. According to Kaplan 2010, the existing natural gas generation capacity could possibly displace up to 30% of coal generation. Beyond this, additional displacement will require new capacity of natural gas units. However, during the period 2006-11 coal shed 256 million MWh which is just 13% of the 2006 generation of 1,919 million MWh. This quantity of displacement can be easily substituted by the existing natural gas units. Hence, it is appropriate to use short-run elasticity. Additionally, a closer look at the price data shows that the relative price effect really kicked in from 2008 when natural gas saw the steepest fall in its price. Moreover, investment in electricity generation has a long life cycle of around four decades or more, so it is reasonable to consider a period of 3-5 years as short-run.
2. Anticipating that natural gas's avid supporters would prefer to use long-run elasticity (on the grounds that many new gas-powered facilities are being constructed, representing long-term shifts), we calculated the displacement under this scenario also. The substitution is higher but not by much: Using the long-run elasticity provided by the EIA, the estimate of coal to gas substitution increases from 35% to 41%.
3. A shift of 728,790 billion BTU of fuel input from coal to gas generation will generate more electricity than coal due to the higher efficiency of gas units. Around 29 million of the total 89 million MWh is the effect of the superior efficiency of gas units.
4. According to the EIA, average heat rate for natural gas combined cycle units is 7,169 BTU per KWh.
Supplemental Exhibit-S1
Supplemental Exhibit-S2
Appendix-1
Appendix-2
Appendix-3
Appendix-4
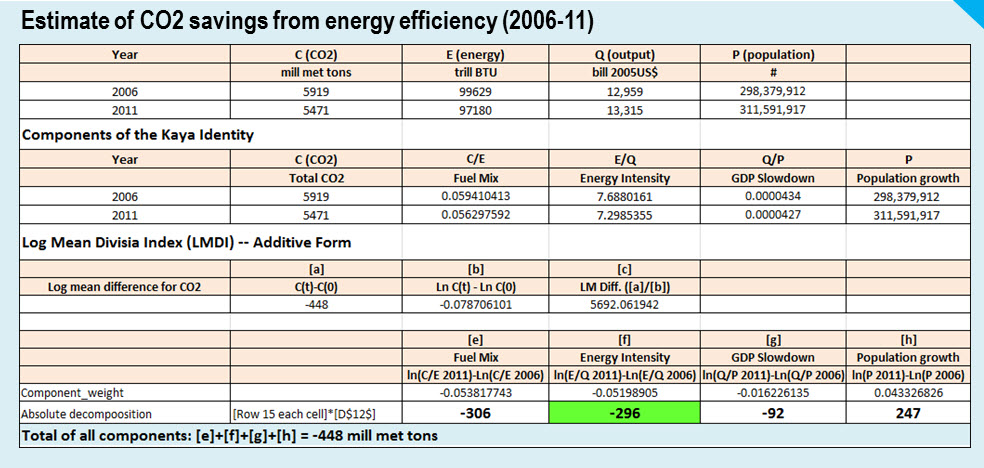
The table below shows a simple estimate of CO2 savings due to the declining energy intensity in the US during the period 2006-11. We apply Log Mean Divisia Index (LMDI) commonly used in energy policy analysis to decompose the effects of fuel mix, energy intensity, income and populations on the changes in CO2 emissions or energy use between any two periods. This methodology shows that around 296 million metric tons of CO2 reduction can be attributed to the economy-wide improvements in energy intensity.
Most of these changes reflect energy efficiency and conservation but it also includes the effects of changes in the economic structure and technological progress like improvements in thermal efficiency when some coal switches to natural gas. While we don’t know the precise quantity of CO2 reduction that should be attributed to the 296 million savings, it is safe to assume that even after such adjustments, the effect of energy intensity will remain sufficiently higher than the CO2 savings of around 50 million tons from price driven coal-to-gas displacement.
Methodology References:
Ang, B.W., Liu, F.L., A new energy decomposition method: perfect in decomposition and consistent in aggregation, Energy, Vol.26, No.6, 2001.
Ang, B.W., Decomposition analysis for policymaking in energy: which is the preferred method?, Energy Policy, No.32, 2004.